1. INTRODUCTION AND RATIONALE FOR THE STUDY
A financial sector plays a transformational and catalytic role in fostering socio-economic growth and development. In other words, a well-functioning financial sector, strengthened by sound financial sector policies, legislations and regulations, is a sin qua non for promoting financial market access for all, and also achieving inclusiveness as one of the top priorities of African governments, within its increasingly dynamic socio-economic and political landscape, which is characterized by jobless growth. However, across and within developed, emerging and developing countries, there are significant disparities in the development of the financial sector. More specifically, empirical evidence from several African countries indicates that the financial industry in Africa is substantially less developed when compared to those in the developed world[1]. Due to the fact that Africa’s financial institutions and structures are weak, Africa continues to struggle with how to make its financial sector more efficient and responsive to the needs of the real sector – agriculture, manufacturing and services, et cetera.
Against the background of the number of financial sector reforms that have been implemented in most African countries in the past four decades, there have been increasing successes in the liberalization of money markets, restructuring of existing banks, enhanced recognition of informal finance, introduction of measures to encourage development of capital markets and private banking systems; and the liberalization of interest rates and prices. This is important given that lack of adequate access to financial services is often a critical element underlying persistent income inequality, as well as slower economic growth (Beck, Demirgüç-Kunt, and Levine (2007), Beck, Levine, and Loayza (2000), Demirgüç-Kunt and Levine (2009), Klapper, Laeven, and Rajan (2006) and World Bank (2012)). For instance, more than 1.5 billion women worldwide remain largely outside the formal financial systems (Demirgüç-Kunt and Klapper 2012).
In this study, individual-level data from nine strategically selected African regional pole countries will be used to investigate the effects of market-based financial sector reforms on access to loans, savings and other credit products by smallholder farmers, youth farmers, and women farmers in selected communities. This study was be carried out in South Africa, Botswana, Angola, Kenya, Nigeria, Equatorial Guinea, Tanzania, Ghana, and Ethiopia, which have been selected due to their experience with financial sector reforms. This article identified the salient ones among the stakeholders’ needs, and also examine the determinants of structural shifts and performance outcomes of the microfinance sectors in Africa. The data for this study was drawn from the Global Financial Inclusion (Global Findex) database that provides indicators which measure how people in 148 economies around the world save, borrow, make payments and manage risk.
Regarding the rationale for this study, this analysis was motivated by two strategic considerations. First, it will fill up a big gap in the literature on the effect of financial sector reforms on socio-economic inclusiveness in selected African communities – South Africa, Botswana, Angola, Kenya, Nigeria, Equatorial Guinea, Tanzania, Ghana, and Ethiopia. While a great deal of work has been documented on the econometric and dialectical analysis of the political economy of financial sector reforms and access to finance by smallholder, women and youth farmers, there has been few or no such studies conducted on the regional growth poles of Africa. Second, the study will provide important policy lessons on financial sector inclusiveness for other potential growth poles that are contemplating utilizing such reforms to enhance financial innovation in their respective countries.
This article is organized as follows. The next section articulates the rationale for the study. Section three briefly reviews the relevant literature on the political economy of financial sector reforms and social inclusiveness in Africa. Section four discusses the methodology used in the study and the expected outcomes. The concluding section discusses the policy options and recommendations.
2. LITERATURE REVIEW
Over the past four decades there has been a gradual worldwide shift, though specific countries may vary, in financial systems from government ownership towards private ownership of financial services (Mody and Abiad 2003). The three main factors Mody & Abiad identified in current literature that influence financial reforms include ‘shock’ events (for example, economic crisis or shifts in global finance), ‘learning’ or gaining knowledge that leads to reconsideration of policy, and a country’s current government’s ideology (Ahmed and Suardi 2009; Mody and Abiad 2003). Even when those three factors are taken into account, reforms are more likely to be implemented when there is moderate liberalization (Mody and Abiad 2003). However, once a reform is implemented, its reversal is rare (Mody and Abiad 2003).
In the past thirty years, many countries in Sub-Saharan Africa liberalized their financial sectors as part of structural adjustment to become more economically developed (Misati and Nyamongo 2012). But even after increased liberalization, financial systems in Africa are still among the least developed in the world (Allen, Otchere, and Senbet 2011). In Africa, there is limited access to savings accounts, restrictions on credit access, and high interest rates compared to the rest of the world (Gulde et al. 2006). In many regions, cash is still the primarily form of financial transaction (Guide and Pattillo 2006; Gulde et al. 2006). Poor financial systems, such as the ones just described, can inhibit growth and prevent poverty eradication (Gulde et al. 2006). On the whole, Africa is the least economically developed continent in the world (Allen, Otchere, and Senbet 2011). However, there is great variation within the continent with, for example, oil producing countries having relatively high GDPs (Allen, Otchere, and Senbet 2011; Guide and Pattillo 2006; Gulde et al. 2006).
Banks play a large role in many African countries’ financial systems. Banks in Africa are not as efficient as they are in other areas of the world and have relatively high operating costs (Gulde et al. 2006). One of the main problems with banks is that even after increased liberalization, they still prefer to loan to large, familiar, low-risk clients (Kabango and Paloni 2011). So, large, established businesses are more likely to obtain credit and benefit from financial liberalization than smallholders (Domeher and Abdulai 2012; Kabango and Paloni 2011).
Poor household credit access is another issue in African financial systems, that can result in limited technology usage and lower productivity (Allen, Otchere, and Senbet 2011; Domeher and Abdulai 2012). When poor households have access to credit, they are able to participate in the economy, obtain an education, and protect themselves from economic shocks (Gulde et al. 2006). However, barriers to credit access exist - these include poor property rights and securing collateral (Gulde et al. 2006). Borrowers may also find barriers such as physical bank access and bank costs, for example minimum required deposits (Gulde et al. 2006).
Personal characteristics can also influence the likelihood of obtaining a loan. For instance, younger and older age groups were more credit constrained than middle age groups (Papias and Ganesan 2010). Educated households were more likely to access credit (Papias and Ganesan 2010). Marital status is theorized to show stability and trustworthiness, therefore married individuals are more likely to be accepted for a loan (Papias and Ganesan 2010). The further households are physically away from financial institutions, the less likely they will be able to access credit (Papias and Ganesan 2010).
Physical distance to financial institutions may be a problem for many small-scale farmers since, there is a lack of rural banking resources (Papias and Ganesan 2010). For example, a study in Rwanda showed that agriculture is over 40% of GDP, yet less than 5% of credit available goes towards agriculture (Papias and Ganesan 2010). The overall share of loans to the agricultural sector has dropped (Gulde et al. 2006). The individuals who do borrow in rural areas have relatively high incomes, whereas lower income individuals access credit informally from markets that do not involve institutions (Papias and Ganesan 2010). The political economy of smallholder agriculture is important to understand because a vast majority of poor people are small scale farmers (Birner and Resnick 2010).
An increasingly popular and successful method of credit access for smallholders is microfinance. Although high growth is occurring in the microfinance sector, it however remains significantly smaller than banking institutions, with only an average of 2.5% of the population partaking in this type of financial service (Gulde et al. 2006). Microfinance involves short period, small loans that are targeted towards poor individuals who cannot usually access credit or other financial services (Allen, Otchere, and Senbet 2011; Gulde et al. 2006; Hartarska and Nadolnyak 2007; Idolor 2012). The borrower then pays back the loan in small sums (Arun 2005). Even though some microfinance institutions (MFI) can struggle from low profits (Gulde et al. 2006), MFIs typically have high transaction costs and interest rates for administration and potential risk (Hardy, Holden, and Prokopenko 2003). Since MFIs tend to have high operation costs they tend to be located in urban areas, making rural access difficult (Allen, Otchere, and Senbet 2011; Gulde et al. 2006). They are operated by various organizations, such as NGOs or governments (Allen, Otchere, and Senbet 2011), and offer financial services such as savings accounts, credit, and development projects (Gulde et al. 2006). Aside from finance, MFIs can also offer other beneficial services to clients, such as training (Hardy, Holden, and Prokopenko 2003). This type of financial service attempts to fill gaps left by other financial institutions (Hardy, Holden, and Prokopenko 2003). The clients may have previously faced barriers when trying to access a loan elsewhere, such as collateral or personal finance (Hardy, Holden, and Prokopenko 2003). Through encouraging economic participation, MFIs can help contribute to GDP growth (Allen, Otchere, and Senbet 2011).
Microfinance could be beneficial to smallholder farmers who often lack collateral and have difficulties finding financial services elsewhere (Domeher and Abdulai 2012; Jama and Pizarro 2008). Collateral gives the borrower an incentive not to default and acts to compensate for potential weak financial characteristics (Domeher and Abdulai 2012). For banks, conflict over property titles/deeds is expensive and time consuming, so land registration means the borrower can easily use their land as collateral (Domeher and Abdulai 2012).
Other alternatives to collateral include group/cooperative loans where the group is held responsible for each individual’s loan, creating social pressure to pay back the sum borrowed (Hardy, Holden, and Prokopenko 2003; Idolor 2012; Jama and Pizarro 2008). Income or a third-party co-sign are other options, but asymmetry may make this method of obtaining a loan more difficult (Domeher and Abdulai 2012). Credit rationing is a result of asymmetry (Papias and Ganesan 2010). Since there is a lack of credit records in many developing countries, information asymmetry deepens (Domeher and Abdulai 2012).
Overall, access to financial services is important, especially for smallholders. Access to finance can be used to fight poverty by helping low income households control their own future and allow them to contribute to the economy (Idolor 2012). For example, farmers can use credit to purchase tools and supplies to increase productivity (Allen, Otchere, and Senbet 2011). Smallholder access to credit has the potential to reduce poverty (Jama and Pizarro 2008). To help create an accessible financial system the government needs to encourage financial institutions in rural regions, build up infrastructure to narrow the distance between rural households and their financial institutions, and to build capacity among staff of institutions as well as borrowing households (Papias and Ganesan 2010).
3. SOURCES OF DATA AND RESEARCH METHODOLOGY
The data on the use of financial services was generated from the 2016 Global Findex Database. The Global Findex data was collected in conjunction with the annual Gallup World Poll Survey. The 2016 Gallup World Poll surveyed at least 1, 000 individuals in 148 economies, using randomly selected, nationally representative samples[2]. The target population is the entire civilian, non-institutionalized population, age 15 and older. Further, the Global Findex dataset includes 41 indicators on the use of financial services around the world. More specifically, this study focused on three main dimensions of financial inclusion among smallholder famers and youths in Africa: (i) ownership – individual or joint – of an account at a formal financial institution; (ii) savings in the past 12 months; and (iii) credit in the past 12 months. It is important to distinguish between cases when individuals save at or borrow from a formal financial institution (such as a bank) or if they use only informal sources.
The collected data for this study was based on the documentation of data on ownership and use of financial services by smallholder groups, by youth or by gender. Thus, this study provided descriptive statistics on three key dimensions of financial services: account ownership (and barriers to account ownership), savings and credit. In order to shed more light on the factors associated with gender differences in the access to and use of financial services, the empirical analysis combined individual-level data on the use of financial services from the Global Findex database with individual-level demographic characteristics from the Gallup World Poll.
The empirical methodology utilized the multivariate regression analysis in exploring whether smallholder differences in the use of financial services are robust after controlling for individual and country characteristics. It also included variables that capture countrywide economic policies reforms against smallholder farmers; and explore the extent to which they may play an explanatory role. The estimation focused on three levels of financial inclusion, whether an individual report: (i) owning a bank account; (ii) saving in the past 12 months; and (iii) borrowing in the past 12 months.
The study adopted the estimation model proposed by Demirgüç-Kunt and Klapper (2012), that is specified as follows:
\[ \mathrm{yij}=\beta \mathrm{x}^{\prime} \mathrm{i}+\gamma \mathrm{z}^{\prime} \mathrm{j}+\varepsilon \mathrm{ij} \hspace{40mm}(1) \]
where y is defined as one of the three dimensions of financial inclusion – owing a bank account, savings, or borrowing – for individual i in country j. Next, x is defined as a vector of individual-level characteristics, z as a vector of country fixed effects, and ε stochastic error term assumed to have a logistic distribution. Among the individual-level characteristics, dummy variables will be included to capture smallholder youth farmers, within country income quintiles, completed level of education, among others. Further, a logit model will be used to estimate the regressions where the dependent variable is account ownership, a binary variable. The nine African regional pole countries that were selected for this study include: South Africa, Botswana, Angola, Kenya, Nigeria, Equatorial Guinea, Tanzania, Ghana, and Ethiopia. The focus of the study was on the effects of market-based financial sector reforms on access to loans, savings and other credit products by smallholder farmers, youth farmers, and women farmers in selected communities located in regional growth poles in Africa.
4. RESULTS
4.1. DESCRIPTIVE ANALYSIS
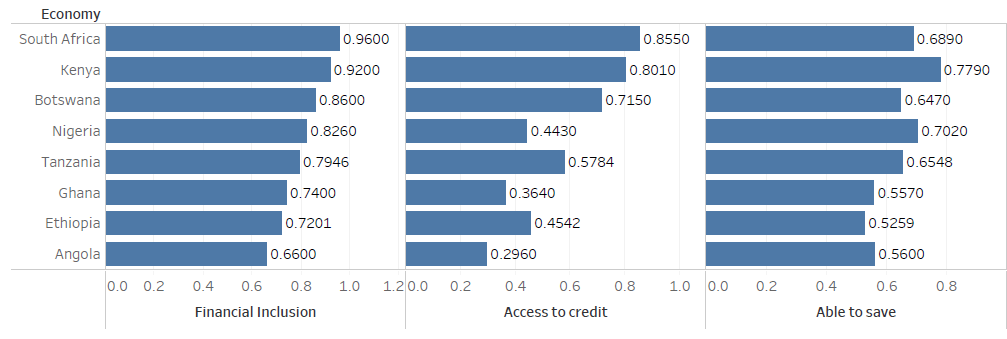
This section describes some of the obstacles people face concerning financial inclusion (access to financial services) across the 8 African countries in this study. In Figure 1, South Africa has the most people with access to financial services, compared to the other countries in this study. Specifically, about 86 percent (69 percent) of South Africans have access to credit (able to save). However, Kenyans have more people that are able to save in this study, compared to the other countries (Figure 1).

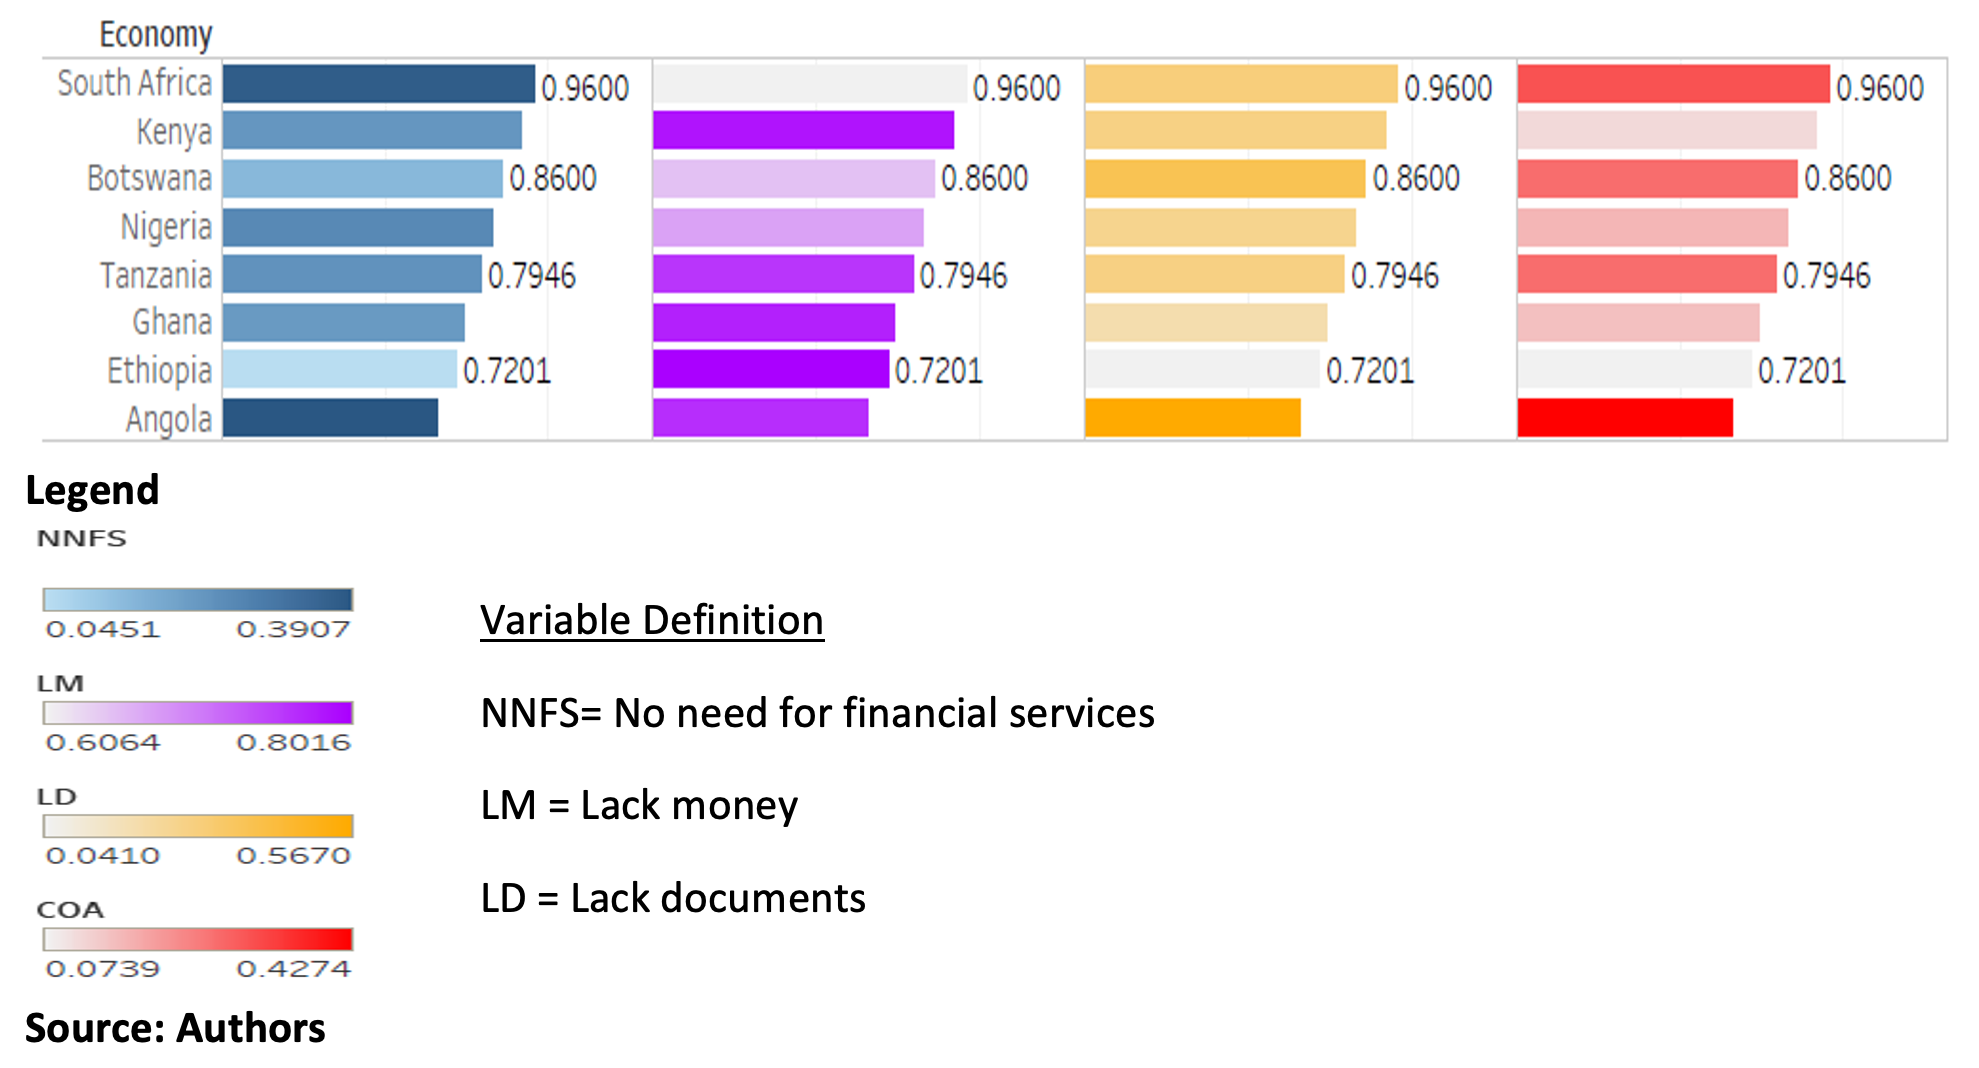
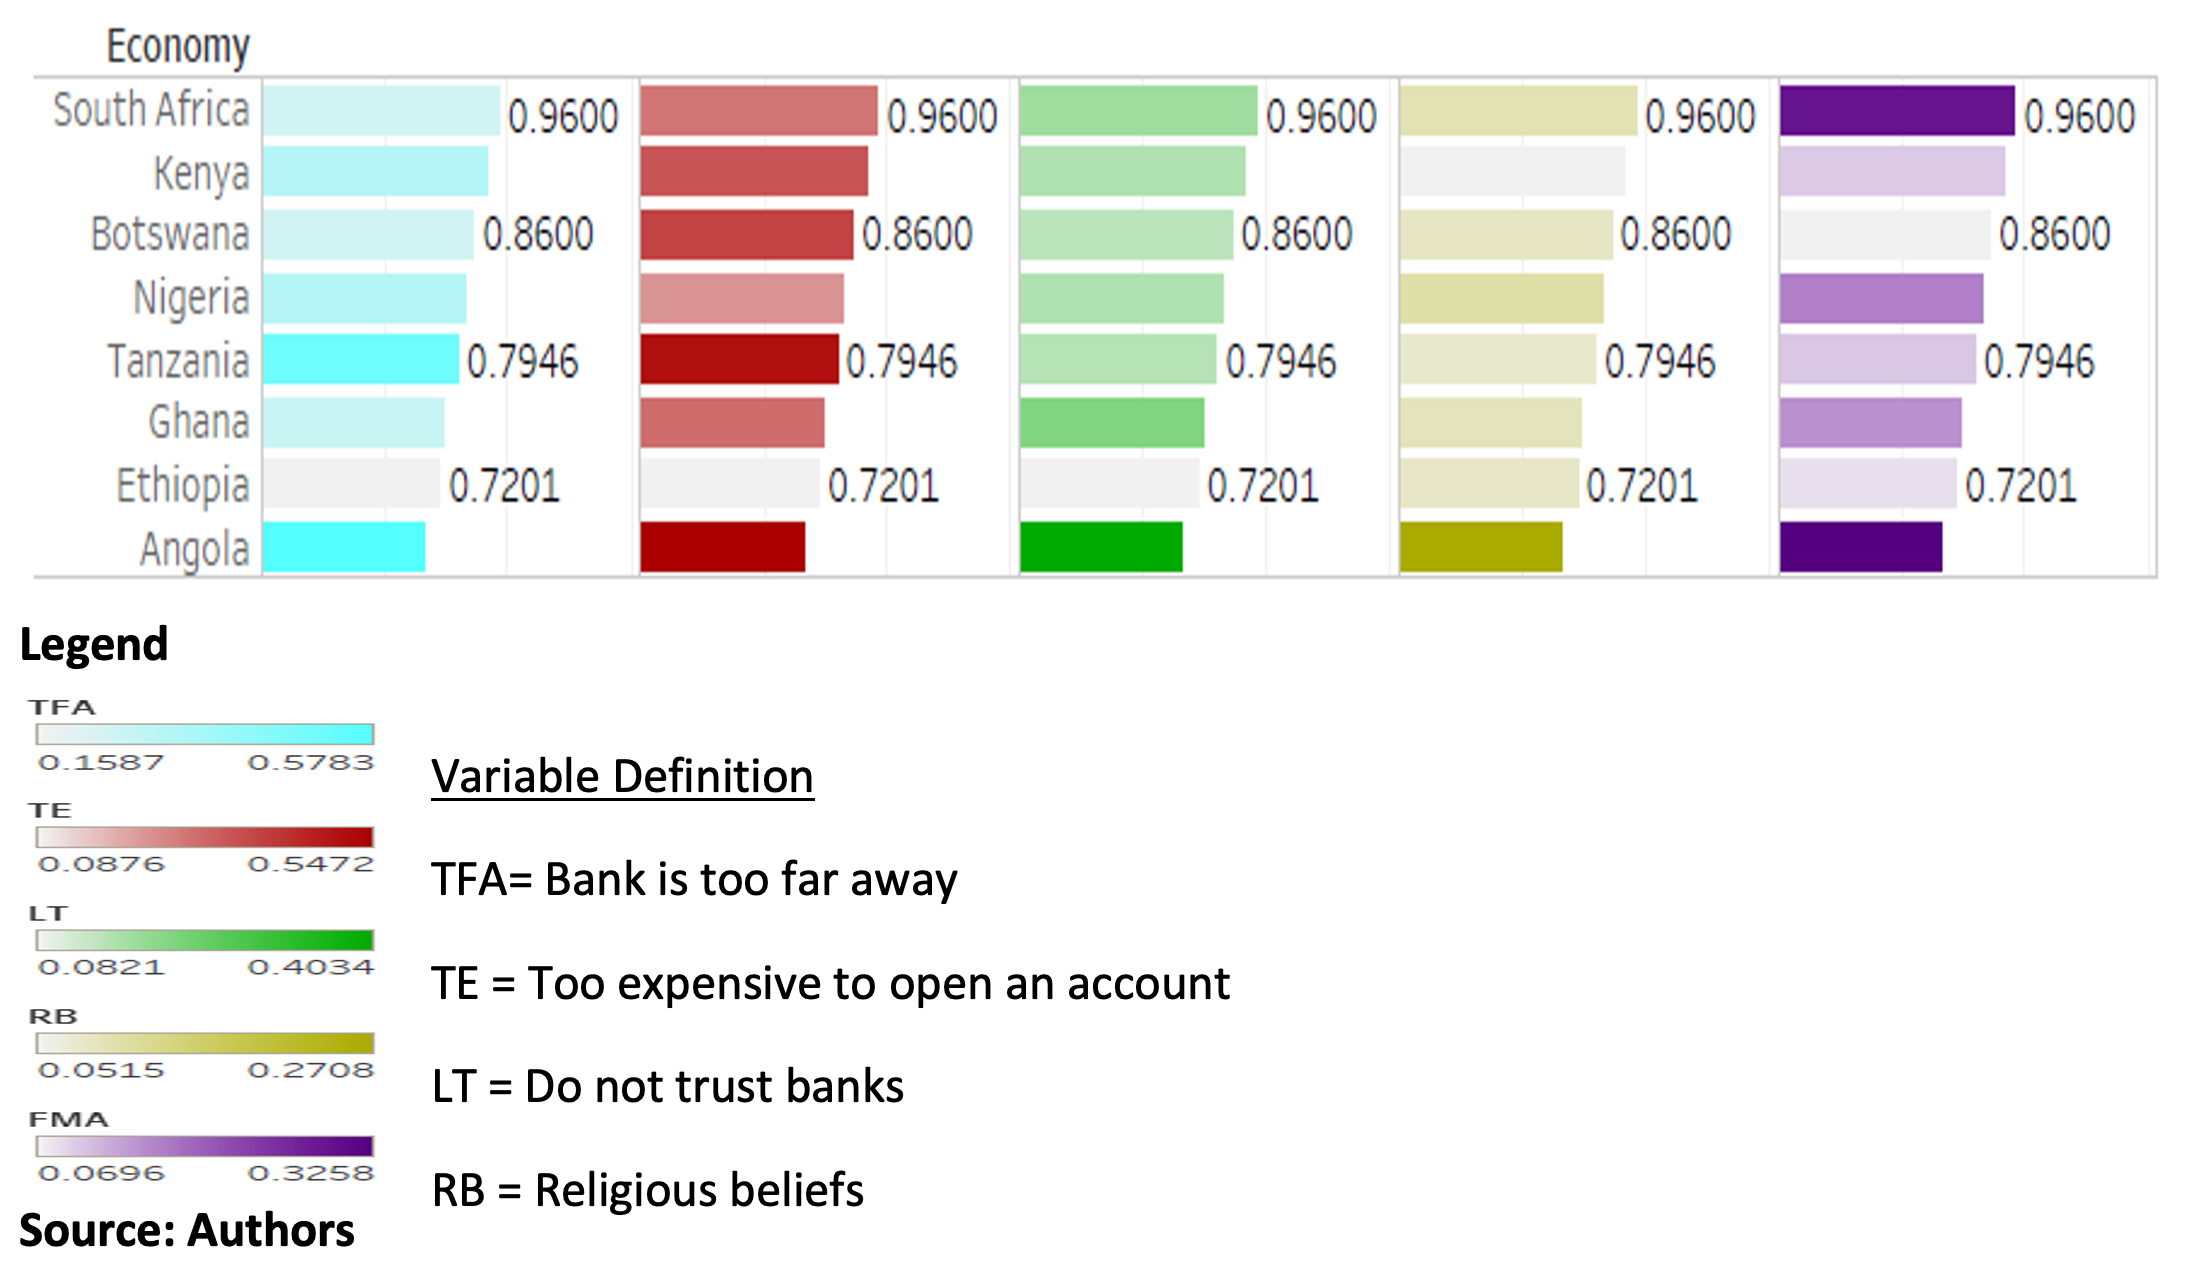
From figure 2, more people in South Africa have no need for financial services or cannot open an account compared to the other countries in this study (Figure 2). Also, in this study, South Africa has more people that are not be able to open an account or lacks the documentation to do so or do not trust banks (Figure 2). In addition, fewer South Africans think lack of money is an obstacle to them opening an account compared to people in other countries (Figure 2).


At the opposite extreme end, Angola has fewer people with access to financial services compared to the other countries in this study. In this study, only 30 percent (56 percent) of respondents are able to access credit (save) (Figure 1). This is not surprising because, compared to the other countries in this study, more people in Angola do not trust banks, think banks are too far away, think it is too expensive to open an account, think their religious beliefs hinders them to open an account, has no need for financial services, think they cannot open an account, and lack money or the documentation to open an account (Figure 2).
Moreover, cross all the 8 countries in the study, about 6490 respondents have access to financial services (financial inclusion) while 1,522 respondents do not (Table 1). The T-test statistic results (Table 2) show that the two groups are statistically different, with regards to the means of the variables that are used to explain financial inclusion. For instance, about 35 percent of respondents who did not engage with the financial system in the relevant countries have secondary education or more compared to those that did have financial inclusion (59 percent). Out of the 1,522 people without financial inclusion, 46 percent are female, compared with the 51 percent of the 6,490 respondents with financial inclusion. The means of the other variables across the two groups are reported in Table 1.
4.2. MODEL RESULTS
4.2.1. Financial Inclusion Model
Overall, the financial inclusion model is significant at 1 percent significance level with a chi-square value of 928. The prediction accuracy of the model is 78 percent. The model results identified age, primary education or less, secondary education or more, employment at a public institution, regular transaction with cash, as well as barriers to formal account ownership such as too expensive to open a formal financial account, and lack of money to open a formal account, as significant variables that could influence the probability that a respondent will have access to financial services (financial inclusion), all things being equal. Also, respondents in Botswana, Kenya, and South Africa are more likely to have access to financial services that those in Nigeria. This is consistent with Figure 1.
A respondent who is older or has at most a primary education or at least a secondary education or employed in the public service or does transactions with cash are about 0.09 percent, 12 percent, 18 percent, 26 percent, 20 percent, respectively, more likely to have access to financial services (financial inclusion). Apart from age, the marginal impacts of the other variables above have economic significance. The results are as expected a priori. Papias and Ganesan (2010) have documented that older people are less inclined to have access to credit in Africa. Also, educated people are able to process information better, and are more likely to find good paying jobs, mostly in the public sector. Therefore, it is not surprising that people with at least primary education are more likely to have access to financial services. Moreover, the higher the education of the individual, the more likely he/she will have access to financial services. This result is consistent with the observation in other similar studies (Papias and Ganesan 2010).
Again, the revelation in this study that people employed in the public sector are more likely to save and have access to credit is expected. This is because most public servants receive their salaries through banks and can be exposed to the operations of a banking institution. In addition, they are able to build trust with the banks which can enable them to access credit. Similarly, for security reasons, people who regularly do transactions in cash will be more likely to save with a bank and access credit.
Moreover, the study shows that individuals in Botswana or Kenya or South Africa are about 9 percent, 16 percent, 31 percent, respectively, more likely to have access to financial services compared to individuals from Nigeria. This shows that there is considerable heterogeneity with regards to financial inclusion across the 8 countries included in this study. However, individuals that think they lack money to open a formal bank account or think it is too expensive to open a formal bank account are about 13 percent and 3 percent, respectively, less likely to have access to financial services.
4.2.2. Formal Account Ownership Model Results
The formal banking account ownership model is, overall, significant at the 1 percent level with a chi-square value of 1722. The model has a prediction accuracy of 90 percent. The marginal impacts (in parenthesis) of the variables that have significant effects on the probability that an individual will open a formal bank account are shown in Table 2. It shows that an older individual (0.13 percent) or individuals in higher income quintile (1.3 percent) or employed in the public sector (13.5 percent) or female entrepreneur (6 percent) or youth farmer (3 percent) or do transactions online (10.4 percent) or do transactions mostly in cash (8.2 percent) are more likely to open a formal bank account. Moreover, individuals in Botswana (4.2 percent) or Kenya (11 percent) or South Africa (14 percent) are more likely to open a formal bank account compared to those in Nigeria. However, individuals who think it is too far to open a formal bank account (17 percent) or have no need for financial services (11 percent) or think it is too expensive to open a formal bank account (9.4 percent) or lack documentation to open a formal account (16 percent) or lack money to open a formal account (29 percent) or a family member has a formal bank account (19.4 percent) are less likely to open a formal bank account. In addition, individuals in Ethiopia (4 percent) or Ghana (2 percent) or Tanzania (4 percent) are less likely to open a formal bank account compared to those in Nigeria.
5. CONCLUSIONS
Financial inclusion has been shown to have positive impact on economic growth and development. According to this study, age, employment at a public institution, regular transaction in cash, as well as barriers to formal account ownership such too expensive to open a formal financial account, and lack of money to open a formal account have significant effects on financial inclusion and also ownership of a formal bank account. Financial inclusion, in this study, includes both ownership of a formal account, and the ability to save, as well as the ability to access credit.
Primary education or less, secondary education or more have significant effects on financial inclusion, but not on formal account ownership. This might suggest, these variables have significant effects on access to credit part of financial inclusion. Also, income quintile, female entrepreneur, transactions online, and obstacles to formal account ownership such as too far to open a formal bank account, no need for financial services, lack money to open a formal account, and a family member has a formal bank account have significant effects on the likelihood that a person will own an account.
In the developed countries’ financial industry, financial information is symmetric, and allocative efficiency is continually being targeted in order to facilitate risk management, and also offer to savers and investors alternative options for diversifying their investment portfolios.
The complete individual-level database, as well as detailed country-level information about the data information about the data collection dates, sample sizes, excluded populations and margins of errors can be found at: www.worldbank.org/globalfindex.