
1. Introduction
The renewed interest of researchers and practitioners in the creation of sustainable microfinance institutions is to a large extent motivated by the ongoing market transition of the microfinance industry, from non-for profit driven organizations towards commercial microbanks (Conning and Morduch 2011; Cull, Demirgüç-Kunt, and Morduch 2009; Baquero, Hamadi, and Heinen 2012). Intrinsic to the evolution of microfinance markets researchers have pointed out an increasing competition for funds (Biekpe and Kiweu 2009; Bhanot and Bapat 2015; Le Saout and Daher 2016), which by driving the costs of funds up may influence the capacity of Microfinance Institutions (MFIs) to become sustainable.[1] This paper presents an analysis of how the loan portfolio quality and profitability of agricultural MFIs, as determinants of sustainability, respond to rainfall shocks, considering the increasing market competition for funds. We concentrate only on agricultural MFIs because, due to a comparatively stronger dependence on governments and donors funding, and higher vulnerability to weather conditions, their capacity to generate sustained revenues appears more exposed to the changing market landscape.
Even though the more market-oriented features of the microfinance industry are relatively recent, concerns about the sustainability of microfinance programs arose with the inception of the industry (Adams and Von Pischke 1992; Adams and Vogel 2014). Researchers pointed out that the advent of microfinance resembled earlier efforts to assist small farmers with credit and that the persistence of factors that contributed to the failure of those credit schemes such as large transactions costs of lending and reliance on funding from donors and government subsidies would also jeopardize the prospects of microfinance. However, unlike conventional credit programs, the microfinance agenda has generally enjoyed flexibility to set interest rates, has triggered innovative lending mechanisms, and has introduced a more diversified array of financial services paving the way for a constant expansion of the industry. Nonetheless, in light of an apparent trade-off between outreach and profitability (Von Pischke 1996; Mosley and Hulme 1998; Conning 1999; Cull, Demirgüç‐Kunt, and Morduch 2007; Hermes, Lensink, and Meesters 2011), and more recently, of an increasing industry competition (Navajas, Conning, and Gonzalez-Vega 2003; McIntosh and Wydick 2005; Ghosh and Van Tassel 2011; Baquero, Hamadi, and Heinen 2012; Cull, Demirgüç-Kunt, and Morduch 2014), sustainability of MFIs has remained a subject of close scrutiny.
We study only MFIs that lend to agricultural producers. Our interest in the agriculture sector obeys three interconnected empirical observations. First, agriculture remains a large source of income for developing countries. Agriculture income represents more than 20 percent of the gross domestic product (GDP) for over half of the 48 nations classified as the least developed by the United Nations, and for 10 out of them it accounts for over 40 percent (IFAD 2011). Second, there is abundant evidence on the positive role of access to financial services on agricultural productivity. Indeed, the influence of removing financial constraints on higher-productivity choices is ubiquitous in the development literature (Yaron 1994; Dercon and Christiaensen 2011; Giné and Yang 2009; Dupas and Robinson 2013), yet the Byerlee et al. (2008) reported that from 400 to 500 million-smallholder farmers in low and middle-income countries face limited access to financial services. And third, agricultural income is highly vulnerable to the occurrence of systemic shocks. The Food Agriculture Organization of the United Nations, FAO (2015) points out that droughts, storms, and floods are the three most important hazards to the agriculture industry. Their incidence increases rural unemployment and has a negative effect in the income of farmers.
The occurrence of regional systemic shocks is of special concern in this paper because of their potential effects on the financial performance of microfinance institutions. Due to the strong correlation of agricultural incomes, a systemic event may severely damage the capacity of farmers to honor financial obligations, on the one hand, threatening farmers’ inclusion into formal financial markets; on the other, threatening the capacity of the MFIs to generate profits. Our analysis focuses on the later, under the presumption that natural shocks degrade the profitability and quality of the loan portfolios of MFIs.
Governments, donors, and practitioners have not overlooked the uniqueness of the agricultural industry. Ultimately, such interest has been often reflected by comparatively more favorable costs of funding to agricultural MFIs (Miller et al. 2010; Cheng and Ahmed 2014). Other researchers have also studied the extent to which agriculture is exposed to natural events. The focus is frequently on creating mechanisms that help to mitigate the exposure of agricultural producers (and indirectly of MFIs) to the vagaries of climate. Departing from conventional policies of indemnity-based insurance products, which have failed to penetrate in rural agricultural markets due to problems of information asymmetry, high transaction costs, limited contract enforceability, and the covariate risk itself (Hazell 1992); more recently, researchers have devised index-based weather insurance schemes (Turvey 2001; Skees et al. 2006; Odening and Zhiwei 2014).
Index insurance bases its indemnities upon the observable value of a specified index, which ideally is a random observable and measurable variable, highly correlated with the losses of the insured, and uninfluenced by the actions taken by the insured farmer. Since there are no loss adjustments at the farm-level but indemnities are determined by the realization of the index, the asymmetric information problems and high loss adjustment expenses are circumvented. Despite these advantages, multiple index insurance initiatives (often heavily subsidized) have not enjoyed great success either (Miranda and Farrin 2012; Odening and Zhiwei 2014). Miranda and González-Vega (2011) have indeed suggested the use of index-insurance as a reinsurance instrument to be used by the microfinance institution rather than by individual producers.
Given the importance of access to finance in agriculture and both the market and natural challenges to create sustainable lending institutions, finding effective hedging strategies that permit agricultural MFIs to achieve sustainability is of utmost relevance. To better understand and address this issue, however, we consider necessary to build a solid basis on the channels through which weather shocks can affect the financial institutions.
2. Research questions
This paper seeks to add nuance to our understanding of how rainfall shocks are transmitted to the MFI by answering two questions:
-
What is the effect of rainfall shocks on the profitability and quality of agricultural loan portfolios?
-
Do financing costs determine how resilient or susceptible the profitability and quality of agricultural loan portfolios are to those shocks?
The answer to the first question is important because the published evidence on the actual effect of weather shocks on the financial performance of the agricultural MFIs is still scant. Related studies are those of Collier, Katchova, and Skees (2011), and Pelka, Musshoff, and Weber (2015). Using time series data, Collier et al. show that the occurrence of the El Niño event significantly increased the number of restructured loans for one MFI in Peru. Pelka et al. use farm-level data to show that excessive precipitation in harvesting periods reduced the on-time repayment of loans granted to small farmers for an MFI in Madagascar. Our econometric approach to answering this query differs in key dimensions.
Unlike the previous works, we construct a unique longitudinal dataset at the MFI level employing financial information from a set of institutions in Ecuador, Mexico, and Peru, rainfall data from weather stations in the regions where each one of the institutions operates, and domestic agricultural and macroeconomic indicators of the three countries. The longitudinal dataset is advantageous because, apart from allowing us to track crucial financial indicators over time, it allows us to account for unobserved heterogeneity. An additional advantage of a longitudinal data set over cross-sectional or time series data is that it offers a larger number of observations, which reduces the collinearity among explanatory variables, improves the efficiency of the coefficient estimates, and increases the degrees of freedom, providing us with enough information to address potential endogeneity of the variables within a dynamic framework. We then estimate the effect of rainfall shocks on profitability and quality of loan portfolio, where profitability is represented by the rate on equity (ROE) and loan portfolio quality takes indicators of delinquency (loan loss ratio, LLR, and write-off ratio, WOR) and of risk (Portfolio at Risk over 30 days, PAR 30, and Portfolio at Risk over 90 days, PAR 90).
The second question aims to determine the influence of funding costs on the resilience or susceptibility of the MFIs to rainfall shocks. In particular, since maintaining the loan portfolio profitable demands strategies to effectively isolate the negative effects of the shock on the portfolio quality of the loan, the MFI is expected to develop more effective lending strategies as the funding cost grows. To our knowledge, no published evidence documents this relationship. In order to guide the empirical analysis, we develop a theoretical model of financing restrictions and profitability in which the MFI chooses the funding and lending amounts that maximize its expected returns. The first order conditions suggest that MFIs with relatively high cost of access to extra funds are more resilient to systemic events. This is because MFIs with relatively higher costs of extra funds optimally would increase profitability by lowering the effect of the systemic shocks on repayment rates (through the implementation of lending strategies that reduce the impact of systemic events on loan risk); in contrast, profitability of MFIs with lower costs would also come from the larger gap between the borrowing and lending interest rates.
We verify the theoretical findings econometrically by testing if the effects of rainfall shocks are conditional on the magnitude of financing expenses. The empirical analysis uses both static and dynamic model specifications. The results indicate that rainfall shocks have statistically significant effects on indicators of risk, PAR30 and weakly on PAR90. On the other hand, the coefficients of rainfall shocks for Loan Loss Ratio and the Write-off Ratio are not statistically relevant. To answer the second research question, we verify whether the negative effects on portfolio risk are mitigated by the cost of funds by looking at the results of the interaction terms. The coefficients indicate that the effect of the shocks on the quality of the loan portfolio indeed depends on the cost of funds. The higher the cost of funds, the lower the negative effect to the shock.
Similarly, our estimates show that annual returns on equity are statistically sensitive to precipitation shocks. Consistent with the theoretical implications, the variables of shock remain statistically relevant when interacted with the cost of funds, but with reversed sign. Overall, the empirical evidence validates the premise that higher costs of funds influence the degree of susceptibility of portfolio quality and profitability of MFIs to systemic events. We do not claim that policies that increase funding costs will cause more resilient financial indicators, instead, we simply document a clear relationship between them and argue that in a competitive environment, those MFIs with higher costs to finance their business will implement lending strategies that lessen the impact of systemic events on the quality of the portfolio, which ultimately will improve profitability. Our findings can aid practitioners to develop strategies focused on building sustainable lending institutions as they show channels through which weather shocks influence the financial performance of the MFIs. These results may also help in the design of funding policies that facilitate the development of agricultural regions. The remainder of the paper proceeds as follows. Section 3 develops the theoretical model. Section 4 presents the data. Section 5 describes the econometric strategy and results and section 6 concludes.
3. A Simple Model of Funding and Lending Choices for MFIs
The agricultural MFI of our interest is a risk-neutral lender that seeks to maximize the returns derived from its borrowing and lending activities. Each period it begins with a predetermined stock of capital which can be increased if the MFI decided to borrow in the interbank market an amount M, in exchange for a per-period interest payment . Next, the microlender apportions L to current loans. Then the limit to outstanding loans is a function of the total available funds, where the function h is assumed to satisfy economic and regulatory capital requirements,
The market interest rate on loans is and the lending costs, are assumed to increase at increasing rates, thus and The remainder is retained as current dividends for the shareholders. The amount of capital available next period follows a stochastic process:
K_{t + 1} = \left(1 - \widetilde{p}_{t + 1}\right)\left(1 + r_L\right)L_t - \left(1 + r_M\right)M_t
where is the random non-repayment loan rate. We assume that the occurrence of a natural shock such as excessive or lack of rainfall increases the value of This assumption is empirically verified in the econometric section, where we determine the effect of rainfall shocks on different measures of the quality of the loan portfolio. This MFI is precluded from investing in the interbank market, so that M is strictly non-negative.
The state transition function is:
g\left( L,M,\widetilde{p} \right) = \left( 1 - \widetilde{p} \right)\left( 1 + r_{L} \right)L - (1 + r_{M})M_{t} \hspace{2mm} (1)
and the reward function is:
\hspace{8mm} f\left( K,\ L,M \right) = \ K + M\ - L - \ c(L) \hspace{9mm} (2)
The MFI maximizes the current and expected future dividends over an infinite time horizon, given its current stock of capital K. The dynamic optimization problem is characterized by the Bellman equation:
\hspace{4mm} V\left( K \right) = \max_{\begin{matrix} M \geq 0 \\ h\left( K,M \right) \geq L \geq 0 \\ \end{matrix}}{\begin{matrix} \left\lbrack K + M - L - c\left( L \right) \right\rbrack \\ + \: \delta E_{\widetilde{p}}V(g\left( L,M,\widetilde{p} \right)) \end{matrix}} \hspace{4mm} (3)
where is the MFI’s per-period discount factor.
The solution to the dynamic model will be a set of policies that prescribe the actions the MFI would take in order to maximize the present value of the dividends. Although the nature of the model limits obtaining an analytical solution, the Euler conditions shown as follows help underpinning some essential features:
\begin{align} \hspace{0mm} \left\lbrack M \right\rbrack :\ &1 + \mu h_{M}^{\prime} + \delta E_{\widetilde{p}}\lambda\left( g\left( L,M,\widetilde{p} \right) \right)g_{M}^{\prime}\left( \cdot \right) = 0 \hspace{3mm} (4) \\ \left\lbrack L \right\rbrack:\ &\delta E_{\widetilde{p}}\lambda\left( g\left( L,M,\widetilde{p} \right) \right)g_{L}^{\prime}\left( \cdot \right) = 1 + c^{\prime}\left( l \right) + \mu \hspace{4mm} (5) \end{align}
where measures the present value of the rewards derived from a marginal increase in the amount of funds available for lending. Alternatively, it represents the costs or rewards forgone given the funding restrictions. The marginal value of the state variable, to the MFI represented by is:
1 + \delta E_{\widetilde{p}}\lambda\left( g\left( L,M,\widetilde{p} \right) \right)g_{K}^{\prime}\left( \cdot \right) + \mu h_{K}^{\prime}\left( \cdot \right)
Since the state transition depends only on the decision taken by the agent, and Equations (4) and (5) reduce to
\begin{align} \hspace{2mm} \left\lbrack M \right\rbrack :\ &\frac{1 + \mu h_{M}^{\prime}}{1 + \mu h_{K}^{\prime}} = \delta(1 + r_{M}) \hspace{27mm} (6) \\ \left\lbrack L \right\rbrack :\ &\delta E_{\widetilde{p}}\left( 1 - \widetilde{p} \right)\left( 1 + r_{L} \right) = \ \frac{1 + c^{\prime}\left( L \right) + \mu}{1 + \mu h_{K}^{\prime}} \hspace{3mm} (7) \end{align}
An interior solution for (6) indicates that the optimal borrowed funds make its marginal benefits equal to its discounted marginal cost. When the solution binds, increasing borrowed funds will increase the present value of all future dividends only when the loans created from an extra unit of borrowed capital exceed the loans that an extra unit of equity capital would produce
The main implications for this paper come from equation (7). An interior solution implies that the optimal quant of loans the MFI originates make the marginal lending cost equal to the discounted “effective” gross interest rate earned on the loan. A binding solution directly links the optimal size of the loan portfolio to the constraint associated with the funding costs. In particular, the lender could increase the lifetime profitability by expanding the amount lent as long as is strictly greater than From the equilibrium condition then follows that, ceteribus paribus, a high intrinsic financing cost, would induce the microlender to reduce its expected nonrepayment rate This is equivalent to state that when the MFI is faced with large costs of accessing to extra funds, it will create strategies to ameliorate the effects of the shock on the quality of outstanding loans.
In the following sections, we test empirically the effects of rainfall changes on the quality of loans and profitability, and whether these effects are conditional on the cost of accessing to funds. For the theoretical implications to be consistent with the empirical results, we should find that systemic events undermine the quality of the loan portfolio and profitability of the MFIs and that such effects are less severe for institutions that face higher costs of funds.
4. Data description
The panel is constructed using the financial reports of the MFIs, precipitation records of the regions where they operate, and agricultural and economic information. The microfinance institution data come from the Microfinance Information Exchange Inc. (Mix Market). In principle, the empirical analysis would focus on Latin America. The agricultural industry in this region is of especial interest because of its comparatively large vulnerability to changes in temperature and precipitation (Nagy et al. 2006). The Mix market publishes data of 436 MFIs that operate in 24 countries in the region. For consistency with the problem of interest, however, we select only MFIs that grant agricultural loans. Additionally, we consider only the subset of institutions reporting most financial indicators over the longest time frame possible. The resulting dataset contains yearly data of 47 MFIs located in Ecuador, Mexico, and Peru, from 2011 to 2015. These three countries host the largest portion of agricultural MFIs in Latin America reporting to the MIX market. On average, their combined Gross Loan Portfolio (GLP) accounted for 35 percent of the total GLP of the 436 MFIs, from 2011 to 2015.[2]
The information of precipitation for the period 2011 to 2015 comes from meteorological and hydrological agencies of every country. For Peru, the information was obtained from Servicio Nacional de Meteorología e Hidrología del Perú (SENAMHI), for Ecuador from the Instituto Nacional de Metereología e Hidrología (INAMHI), and for Mexico from Instituto Nacional de Investigaciones Forestales, Agrícolas y Pecuarias (INIFAP). The raw data was then processed as follows: (i) identify the main geographical regions where each MFI offers credit services,[3] (ii) locate all weather stations within the region, (iii) identify sub-regions where the top agricultural goods (as measured by planting area and contribution to local agricultural GDP) are harvested within the regions identified earlier, (iv) obtain rainfall data from the weather stations nearest to the agricultural sub-regions defined in (iii).
The sources for macroeconomic and agricultural information are specialized domestic agencies. The economic data from Peru is provided by the Instituto Nacional de Estadística e Informática (INEI) and the agricultural information by the statistical unit of the Ministerio de Agricultura y Riego (MINAGRI). This information is available at the Sistema Integrado de Estadísticas Agrarias (SIEA). In the case of Ecuador, agricultural and economic data come from the Instituto Nacional de Estadística y Censos (INEC) and the Dirección Nacional De Síntesis Macroeconómica, respectively. And for Mexico the information was obtained from and the Instituto Nacional de Estadística y Geografía (INEGI) and the Servicio de Informacion Agroalimentaria y Pesquera (SIAP). In what follows we describe the dependent and main independent variables of interest used in the econometric analysis.
4.1. Dependent variables
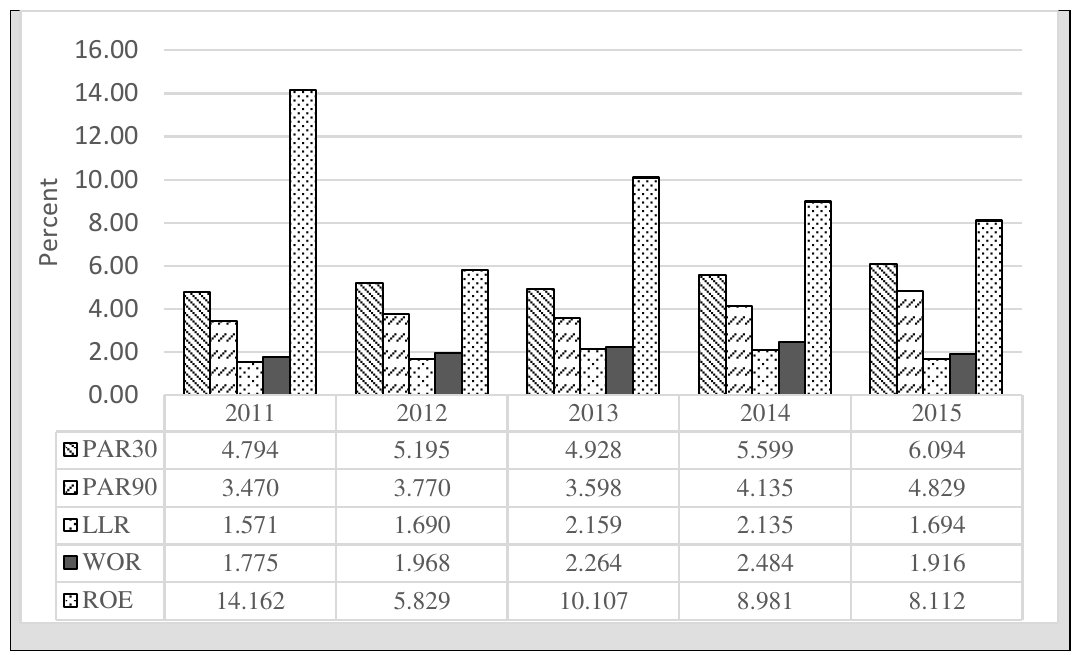
The response variables of interest are measures of loan portfolio quality and of MFI profitability. To proxy for quality of the loan portfolio we include two measures of portfolio risk, PAR30 and PAR90, and two measures of portfolio delinquency, LLR and WOR. Portfolio at risk (PAR) broadly refers to the outstanding amount of loans with at least one delinquent installment over 30 days, PAR30, or over 90 days, PAR90. Portfolio at risk is calculated as the ratio of outstanding balance of all loans with arrears over the period under consideration to the total outstanding gross portfolio (Von Stauffenberg et al. 2003). Write offs are loans removed from the loan portfolio balance because they were internally deemed uncollectable. The write-off ratio (WOR) is the fraction of total write-offs to the average gross loan portfolio. Loan loss rate (LLR), as a measure of unrecovered loans, is calculated by dividing the total written-offs minus the loans recovered during period by the average gross loan portfolio. The dependent variable used to measure profitability is the return on equity (ROE). ROE is the proportion of net operating income minus taxes to the average equity and represents a close measure of financial sustainability.
Average values of all dependent variables are displayed in Figure 1. As it can be seen PAR30 remained below 6.1 percent and PAR90 below 4.8 percent during the period. These values indicate that borrowers tend to pay back loan installments by the due date more often over 90 days than over 30. In general, these values reflect financially sound loan portfolios[4] and, except for 2015 where both measures appear slightly higher, they suggest the quality of the portfolios is also fairly stable. Occasionally, institutions implement policies to improve indicators of risk at the expense of higher delinquency measures. This does not appear to be the case for this sample, as the indicators of default, LLR and WOR, fluctuate narrowly around 1.8 and 2.0 percent respectively, suggesting genuinely sound and resilient loan portfolios. The values of ROE indicate that the relatively high profitability achieved in 2011 (14.16 percent) could be due to an abnormal good harvest year as the ROE in the following years declined abruptly. Droughts and floods in productive areas of Peru and Ecuador (FAO 2013) caused significant production loses of commodities such as corn, potatoes, and coffee during those years (2012 to 2014), which may explain the declines in profitability. Macroeconomic and other variables could also explain this pattern, so we will rely on the econometric analysis to discern if precipitation is indeed a statistically significant factor.

4.2. Main independent variables
4.2.1. Rainfall shocks
Rainfall shocks are the first principal explanatory variables of interest. Our approach to construct the shocks is similar to Maystadt and Ecker (2014) and Pelka, Musshoff, and Weber (2015). Specifically, for each meteorological station (j) and year (y), there are two shocks, one for the agricultural crop season Summer-Autumn (SA) and the other for the season Winter-Spring (WS), which are measured as:
\hspace{12mm} Shock_{s}^{j,y} = \frac{1}{n}\frac{\sum_{m = 1}^{n}{P_{j,y,m} - \mu_{j,s}}}{\sigma_{j,s}} \hspace{13mm} (8)
where n is the number of months in the agricultural crop season s;[5] the weather station and Here is the amount of precipitation in month m, station j and season s. The sum then represents the accumulated precipitation of the season (from month m to month n). Thus, the numerator is the difference of the total seasonal precipitation with respect to the average historical precipitation of the station j in season s, Positive values reflect seasons that were wetter than normal and negative values, seasons drier than normal. This difference is divided by the long-term seasonal standard deviation to take into consideration the historic precipitation volatility of each season that both producers and MFIs could have already internalized in their operations.[6] Therefore, the resulting measure of precipitation shock indicates how intense the average monthly precipitation in each season was, as compared to the historical values.
Table 1 shows average levels of precipitation in the two seasons for the three countries. One can see that the season SA is historically wet, but while in Mexico the average precipitation has been above the historic mean (954mm) in recent years, Ecuador and Peru have lately experienced comparatively dry SA seasons. Precipitation during the season WS is historically lower, 246 mm in Ecuador, 236 mm in Mexico and 284 mm in Peru. The values against the mean again suggest that Mexico has experienced abundant rainfall, in contrast to Ecuador and Peru with consecutive dry seasons. The distance from the seasonal rainfall to the historic mean indicate the intensity of the hardships, the extreme values are a priori expected to influence the business of agricultural finance institutions.
4.2.2. Cost of funds
We use financial expenses on funding liabilities (FEFL) as a proxy for the cost of funds. It captures all costs incurred in raising funds from third parties, including deposits, borrowings, subordinated debt and other financial obligations, in addition to fees expenses from non-financial services (Microfinance Information Exchange 2017). FEFL also includes commercial and concessional borrowings. Commercial borrowings are the Funds received by an MFI through a loan agreement or other contractual arrangement that carry a market rate of interest (Von Stauffenberg et al. 2003). This measure is divided by the total Gross Loan Portfolio (GLP) to generate a standardized measure of funding costs across MFIs in all countries.

Figure 2 shows the different levels of funding costs for all MFIs separated by country. In each panel, the x-axis measures time, the y-axis displays the standardized FEFL, and the size of the dots indicate the average interest rate on loans. Comparing the standardized measure of cost of funds across countries, it can be observed that MFIs in Peru face large funding costs, more than ten times the cost for MFIs in Mexico and about twice as much as those in Ecuador. Perhaps because of this, Peru has maintained the highest values of lending interest rates with 18.7, 19.2, 18.1, 15.7 and 16.1 percent for the years 2011 to 2015 respectively, while the lending interest rates in Ecuador and Mexico have kept below 5.5 percent. The tendencies are also worth noting, for instance, while in Ecuador the cost of funds is raising, in Mexico it remains low and stable, whereas in Peru this cost is declining (in 2015 was far below the costs in previous years). In general, the graph shows substantial heterogeneity in funding costs, which, among others, can be explained by country specific social and macroeconomic conditions. The econometric analysis includes controls for the MFIs financial structure, macroeconomic conditions, and agricultural activity.
Table 2 presents descriptive statistics of the complete set of variables used in the econometric exercises.[7] The values of the indicators of risk and profitability suggest a nontrivial heterogeneity in the financial performance of the institutions. Consider, for instance, that while the average PAR30 and PAR90 was 5.42 and 4.05 percent, respectively, the maximum reached 40.15 and 36.83 percent. The extreme values of ROE are also worth noting as the minimum of -216.02 percent largely differs from the maximum of 64.90 percent. Although these values could be considered outliers, they are included in the analysis as they can be explained by the extreme levels of precipitation. For a deeper understanding of the ROE of -216.02 percent, for example, we find that it corresponds to an MFI in Peru that operates in a region that suffered severe droughts in the corresponding periods.
Table 3 presents the correlation matrix for the independent variables. The matrix comprises weather shock variables (ShockSA and ShockWS); financial variables (cost of funds, equity, lending interest rate, outreach, and borrowings), the size of the MFI proxied by the amount of total assets, agricultural GDP, and sown area. The matrix does not indicate serious correlation among the variables, but there are a few significant associations. For instance, cost of funds (FEFL/GLP) appears to be statistically correlated with several variables. The variance-inflation-factor (VIF) was computed to check for multicollinearity. The resulting VIFs remain below 10, generally suggesting collinearly is not a severe problem (Curto and Pinto 2011).
5. Econometric Analysis
A generic representation of the model of interest is expressed as follows:
\begin{align} \hspace{2mm} y_{{ikt}} = \ &\beta_{1}Shock_{ikt}^{SA}{+ \beta}_{2}Shock_{ikt}^{WS} \\ &+ \beta_{3}{\ FEFL/GLP}_{ikt}\ \\ &+ \ \rho_{1}(Shock_{ikt}^{SA}\cdot {FEFL/GLP}_{ikt})\ \\ &+ \ \rho_{2}(Shock_{ikt}^{WS}\cdot {FEFL/GLP}_{ikt}) \\ &+ X_{ikt}^{\prime}\mathbf{\alpha} + c_{i} + u_{ikt} \hspace{31mm} (9) \end{align}
where the dependent variable takes the measures of portfolio quality and profitability of the MFI i located in country k in period t. The rainfall shocks, named Shock, identify the variable for the two different seasons, SA and WS. The term is the proxy for costs of funds, measured as financial expenses for funding liabilities weighted by gross loan portfolio. The matrix contains the set of time-varying independent variables described above. The econometric representation incorporates unobserved individual characteristics, such as risk aversion and entrepreneurial ability of the lenders that can also influence the financial performance of the MFI.[8] The error term is
The answer to the first research question arises from the coefficient estimates associated with the variables of Shock, and to the second from the estimates of interaction terms ). A first set of results is obtained by applying standard fixed effect estimations, as stated in equation (9). The coefficient estimates from these models provide valuable insights into the research questions, but we recognize that some estimation issues may question the validity of these results. First, consistent estimators require the independent variables and the error term to be uncorrelated. Whereas the precipitation shocks satisfy the exogeneity assumption for panel data estimation because of their random nature, simultaneous causality between cost of funds and the dependent variables cannot be ruled out. The endogeneity is to some extent handled when the variable is interacted with the measures of rainfall, but lack of instruments prevents us from fully addressing the problem.[9] Another important issue is the omission of the dynamism described in the theoretical model. It matters because the lending and borrowing choices in current periods are theoretically driven by the financial performance in previous periods. In an effort to incorporate the dynamic nature of the business, a second set of regressions is run within a dynamic panel data framework. This will help us to capture time-dependence of financial performance and implicitly the dynamic lending choices of the MFIs. Since with lagged dependent variables the strict exogeneity assumption for panel data estimation will not hold, the estimations are carried out applying the Generalized Method of Moments (GMM) proposed by Arellano and Bond (1991). While accounting for individual heterogeneity, it also helps us to control for the simultaneity bias generated by the endogeneity of the explanatory variables of interest. The two set of results for the estimates of portfolio quality (Table 4) and of profitability (Table 5) are discussed below.
5.1. Portfolio Quality
Consider first the estimates of the effects of seasonal rainfall shocks alone on the measures of risk, first on PAR30 and next on PAR90 shown in Table 4. While the effects of rainfall shocks during the crop season Summer-Autumn are statistically zero on PAR30, extreme rainfall during the season Winter-Spring is highly statistically significant. It means that when the average rainfall during the WS season deviates from the historic mean, the portfolio at risk over 30 days increases. Assuming funding costs are zero, the coefficients of 0.011 imply that when the deviation is of one unit, the outstanding balance of loans with arrears over 30 days goes up by 0.011 percentage points. The relationship is robust to the different specifications (I) to (IV). The coefficients associated to PAR90 would describe a similar relationship, except that when including variables of controls in (II) and (III) the coefficients are no longer statistically significant at conventional levels. The estimates in the dynamic specifications (IV) point out that current values of PAR30 and PAR90 are strongly influenced by the performance of the MFI in the previous period as the lagged variables are positive and statistically different from zero. The empirical results then justify the dynamic setup for the indicators of risk and validate the assumption in the theoretical model that precipitation shocks can have a negative impact on repayment rates.
We now look at the estimates of the effect of shocks on the variables of delinquency, LLR and WOR. In both indicators, Loan Loss Ratio and Write-off Ratio, the coefficients of rainfall are statically zero. These results could reflect an effective risk profiling of borrowers by the MFIs. In other words, the resilience of delinquency variables could indicate that the borrowers successfully internalize the risk exposure of their credit applicants in their credit decisions. They may also be driven by self-selection bias. Since reporting financial records to the Mix Market is voluntary (in part motivated by the potential to attract and satisfy investors and donors), these MFIs are likely to operate more efficiently than those that chose not to disclose their information. In summary, the results so far demonstrate that the measures of portfolio risk are statistically influenced by the occurrence of extreme values of precipitation, but that such effects do not permeate into the measures of portfolio delinquency, which rather indicate resilience. Our findings are in line with previous studies that point out that weather shocks can reduce the quality of loan portfolios (Collier, Katchova, and Skees 2011; Pelka, Musshoff, and Weber 2015). While Collier, et al. find the effects of a weather event on re-structured loans, our analysis shows the effects reach the riskiness of the portfolio, which is closer to the results of Pelka et al., who find the negative effects of the shock on the timely repayment of the loans. With these findings, the first research question for portfolio quality is answered.
To respond the second research question, we focus on analyzing the estimates of the interaction terms between the shocks in the season WS and FEFL/GLP in Table 2. If the positive effect of the shocks on PAR30 is conditioned on the size of the cost of funds, the coefficient interaction terms must take the opposite sign. The estimates show that not only the signs are consistent with the prior expectations, but they are statistically significant and robust to all specifications on PAR30. More specifically, the negative signs indicate that increments in the cost of funds ameliorate the magnitude of the effect of the rainfall shocks. For example, if the standardized measure of costs of fund was zero, a unit increase in the shock (that is, in level of rainfall above the mean over historic standard deviation) increases the PAR30 in 0.011 percentage points, but when the costs of funds are set at its mean value (6.89), the same unit increase in the shock has an effect of almost zero in PAR30, i.e., the effect of the shock is less severe when the cost of raising funds is incorporated. The higher the cost of fund, the lower the effect of the rainfall shocks on the measure of portfolio at risk.
Before exploring the effects on profitability, it is worth noting that the static models with controls for LLR and WOR, (II) and (III), reveal some degree of substitution between FEFL/GLLP and the rainfall shocks. In particular, the models indicate that delinquency rates are positively correlated with funding costs, but that the more rain occurs during the season SA (over the historic mean) the lower will be the effect of the funding cost on deliquency. This interpretation comes from both the significant and positive effect of FEFL/GLP and the statistically significant but negative effects of the interaction between FEFL/GLP and Shock SA.
5.2. Profitability
Consistent with the previous results and the implications derived from the theoretical setup, extreme rainfall is expected to diminish MFIs’ profitability. The econometric results in Table 5 support the premise strongly for the rainfall shocks originated in the season Winter-Spring (ROE will drop by 0.091 percentage points in the full specification) and is robust to all econometric specifications. The profitability of the MFIs declines the more the precipitation level deviates above the mean. These variables remain statistically relevant when interacted with FEFL. As the interaction terms have the opposite sign. The implication is consistent with the theoretical findings, that is, higher costs of funds lessen the magnitude of the precipitation shocks on profitability.
The explanation for the main empirical findings comes from the equilibrium conditions in the theoretical setup. From equation (7), ceteris paribus, an MFI with relatively higher costs of extra funds would optimally increase profitability by lowering the effect of the systemic shocks on repayment rates. This means that to generate sustained profits, the MFIs facing comparatively higher costs of funds, will require the implementation of lending strategies that reduce the impact of systemic events on loan risk. In contrast, when the cost of funds is relatively low, the potential effect of the systemic shock is less of a burden. The rationale is closely related to the empirical findings of Kyereboah‐Coleman (2007). He suggests that highly leveraged microfinance institutions perform better because they are better able to manage credit risk. In particular, the high leverage serves as an incentive to generate the cash flows needed to pay interest expenses, which pressures the management to create strategies to better deal with issues of asymmetric information, which in turn improves the profitability levels of the institution.
It is worth noting that in most specifications the effect of the rainfall shocks in the season Summer-Autumn on ROE is also significant. In contrast to the negative effects of the shocks in the season Winter-Spring, the signs of the coefficients here are positive, which imply that MFIs would improve their profitability levels if the amount of rain in the period Summer-Autumn increased. Historically it is during this season when the level of rainfall raises (see Table 1) and when the growing of mayor crops occur. The results suggest that the levels of rain have been below the desired levels. This finding is of great importance because it allows us to show that the effect of extreme rainfall on ROE is not uniform, but varies over the crop seasons. The interaction effects (Shock SA * FEFL/GLP), confirm that FEFL/GLP lowers the effect of the shocks. Consistent with the previous interpretation, higher cost of funds will encourage the adoption of lending strategies that mitigate the impact of unexpected events.
6. Conclusions
The capacity of agricultural microfinance institutions to generate sustained revenues is highly reliant on weather conditions, and the recent commercial orientation experienced in the microfinance industry could further undermine it, due to their comparatively stronger dependence on governments and donors funding. This paper adds nuance to our understanding of how systemic events are transmitted to microfinance institutions that lend to agricultural producers by investigating two interlinked hypotheses. The first hypothesis suggests a close relationship between the occurrence of rainfall shocks and the portfolio quality and profitability of the MFIs. The second proposes that such relationship is not independent of financial expenses, but that the degree of resilience or susceptibility of the financial indicators is influenced by the costs of funds instead.
In order to validate these premises, we constructed a unique longitudinal dataset at the MFI level employing financial information from a set of institutions in Ecuador, Mexico, and Peru, rainfall data from the nearest weather stations for each one of the institutions, and domestic macroeconomic indicators of the three countries. The first hypothesis was tested by estimating the effect of rainfall shocks on the quality of loan portfolio and on profitability. Portfolio quality is represented by indicators of delinquency (loan loss ratio, LLR, and write-off ratio, WOR) and of risk (Portfolio at Risk over 30 days, PAR 30, and Portfolio at Risk over 90 days, PAR 90), whereas profitability was represented by the rate on equity (ROE).
The empirical results come from different econometric model specifications. The first set of regressions run simple static fixed effects models. Next, a second set of regressions was run using the Arellano-Bond linear dynamic panel-data estimation . This allowed us to capture time-dependence of financial performance and the dynamic choices of the MFIs and to control for a simultaneity bias caused by the endogeneity of some explanatory variables.
The results demonstrate resilience of delinquency measures to rainfall shocks. This implies that the amount of uncollectable loans is not influenced by the occurrence of shocks, in turn, it could reflect an effective use of hedging strategies. On the other hand, indicators of portfolio risk are statistically significant to the occurrence of rainfall shocks during the crop season Winter-Spring. This means that extreme precipitation indeed undermines the quality of loan portfolios by increasing the outstanding balance of loans with arrears. The latter is in line with the estimates of profitability that showed that the ROE is also significantly sensitive to precipitation shocks. Because the published evidence on the actual effect of weather shocks on the financial performance of the MFIs is still scant, these results serve researchers and practitioners to better understand the exposure of MFIs to systemic events and then develop hedging instruments.
To test the second hypothesis, we incorporated financial expenses on funding liabilities (FEFL) over Gross Loan Portfolio (GLP) as a proxy for cost of funds in the econometric estimations. The results lead us to conclude that the extent of the effect of precipitation shocks on the quality of the loan portfolio is not independent of the cost of funds. In particular, we found that the loan quality of MFIs with relatively low costs of funds is prone to suffer more the occurrence of the shocks than the loan quality of a MFIs with higher costs. The empirical results should not be used to demonstrate a causal relationship. We simply show that there is a significant relationship, which is consistent with our theoretical derivations. We showed that the costs of funds have a significant influenced on how profitability of the MFI respond to the shock. We argue that an MFI that is constrained by relatively high costs of funds implements lending strategies that better isolate the impact of systemic events on loan risk in order to generate profits. In contrast, the occurrence of the systemic shock will have less influence on the types of lending strategies employed by an MFI with relatively low cost of funds as it does not constraint its capacity to generate profits.
While we encourage more research to validate our results, results from this work can aid practitioners to create strategies to build sustainable lending institutions. Our findings show some channels through which weather shocks can affect their financial operations. More generally, these results may also help in the design of funding policies that facilitate the financial development of agricultural regions as, to our acknowledge, no published evidence documents the relationship between the costs of funds and the resilience of the MFIs to rainfall shocks.
Some limitations of our analysis should be acknowledged. The most important limitations are related to the availability of data. For instance, despite our attempts to address endogeneity between the financial variables of interests, we recognize that stronger instruments will benefit the validity of the estimations. The short time series employed also constrained our ability to generate other measures of rainfall shocks and further test the robustness of the results. Despite these limitations, we are confident about the soundness of the theoretical and empirical methods applied. Our main results contribute to the financial development literature focused on investigating mechanisms for the efficient provision of financial services to the rural poor.