

1. INTRODUCTION
In order to help achieve the national objectives of balanced development, many countries have adopted Directed Credit Programs (DCP). The broad objective is to ensure that there is sufficient civic engagement in credit policy of banks so that the economic growth of the country is not just fast, sustainable, but also balanced and inclusive. Various studies have highlighted the need for directed credit program (DCP) and its positive impact on the economic development of a country and on various sectors of the economy (Eastwood and Kohli 1999; Burgess, Pande, and Wong 2005). It has, however, been seen that the success of such a program rests on many factors, including its availability to the deserving and needy borrowers (Schwarz 1992; Calomiris and Himmelberg 1993; Stiglitz and Uy 1996; Kohli 1997; Llanto, Geron, and Tang 1999; Rezitis, Tsiboukas, and Tsoukalas 2003). The prominent priority sectors under the directed credit programs in most countries include areas like small-scale industry (Japan, Korea, India, USA, Philippines, etc.) and agriculture (Brazil, Pakistan, India, Philippines, USA, etc.). Both sectors employ a large number of people, occupy small size owners and are geographically well dispersed across the entire nation (Shirota, Paulo, and Meyer 1990; RBI Paper 2005).
A substantial proportion of the funds of the financial system is deployed in DCP of a country. For instance, it is 20% each in Thailand and Indonesia, nearly 36% in Brazil, 40% in India, and so on. These funds are thus not available for any other productive use. Further, these funds are primarily public money. It is therefore important to assess the performance of this program, from time to time, considering specific aspects, in order to ensure that it is made more effective.
In India, the government had introduced the Directed Credit Program (DCP) in 1968 and it was termed as the “Priority Sector Lending” (PSL) program. This was done through the Central Bank, i.e. the Reserve Bank of India (RBI), with the primary aim of serving the social objectives of growth. Under this program, the RBI has stipulated that at least 40% of Average Net Bank Credit (ANBC) or of credit equivalent amount of Off-Balance sheet Exposures (OBE), whichever is higher, must be given by banks to certain priority sectors. These sectors include agriculture, small-scale enterprises, weaker sections, export credit, housing, education, etc. The two terms, directed lending and PSL, and accordingly, DCP and PSL program, are used interchangeably in the present study.
The directed credit program or the PSL program in India, was initially designed to serve the national priorities, mainly of balanced development of various sectors and sections of the society, by providing priority in lending to those sectors and sections, which may otherwise not receive adequate attention of the lenders. A similar sectoral focus is seen in the DCP of many other countries as well (presented in Table A of the appendix). However, the concept of balanced development normally includes both sectoral and regional balance. It is therefore, important to assess if the program design can be made to align to both these national priorities. In the absence of such an analysis, the contribution of the program to serve the national priorities may be only partial and not complete. With some changes in the program design, it can be made to align to the other national priority of balanced regional development, as well. Since the program deploys a substantial proportion of the bank funds, they should be utilized in an optimal manner and not for limited objectives. This is especially important in the current scenario where many banks are under financial stress.
Further, despite nearly five decades of the program having been in place, there does not seem to be a significant change in income levels of the population dependent on these priority sectors for employment and income disparities continue to remain high. We need to investigate the situation and make suitable changes in policy design and implementation so that the PSL program yields more productive and socially desirable outcomes.
While there may be other facets to balanced development of a country, like with regard to sectors, population segments, etc., one of its key aspects is in terms of its balanced regional is a key aspect of development. Absence of this can have adverse economic, social and political implications for a country (Ahluwalia 2000; Jha 2000; Ray 2010). This is particularly so for many of the developing countries, which experience high regional disparities in economic development.
Therefore, in view of the objective of balanced economic development as part of a nation’s priority, it is important not only to select the sectors which should be included in DCP, but also to ensure that appropriate focus remains on the less-developed geographic regions and areas of the country. Nepal’s DCP, therefore, follows an area development approach to benefit borrowers within a specific geographical area (RBI Paper 2005). The banking policy in Turkey requires state owned banks to play an implicit role in reducing disparities by allocating more loans to underdeveloped regions (Önder and Özyıldırım 2010). In addition, the finance growth nexus has been explored by many studies in the past.
Balanced regional development is also the prime objective of the national economic policy of India. The government emphasizes the need for economic growth to be not only fast, but also to involve all sectors, regions and segments of the population, to ensure an inclusive and balanced growth process (An Approach to twelfth five-year plan, 2012-17). The National Development Council (NDC) has accorded the status of Special Category State (SCS) to eleven (out of twenty-eight) states, which have been characterized by a number of features necessitating special consideration. Further, the BIMARU states (Bihar, Madhya Pradesh, Rajasthan and Uttar Pradesh), whose growth lags behind that of the more developed states, also need attention for development. These states account for a majority of the Indian population but their development lags behind the national average, highlighting their demographic malady (Bose 1988). They fall in the same category of BIMARU states even after almost three decades of their initial placement into this category (V. Sharma 2015). Further, the Rajan Committee Report (2013), based on the underdevelopment index proposed by them, has identified a few states as “least developed” states.
In spite of these national priorities, considerable disparities in economic development have been noticed across various states and regions in India (Ahluwalia 2000; Jha 2000; Singh et al. 2003; Ghosh and Chandrasekhar 2003). It has been noticed that some states and regions, which are more economically advanced, receive more attention from lenders and policy makers than the others. Further, given the social objective of PSL as achieving balanced growth, and its significance in reducing regional disparities, it is worth finding out whether it is actually flowing to states, which need it more and rank high in national priority. Certain state-specific characteristics may be significant determinants of per-capita PSL and may account for drawing more credit from the banks.
The present study, therefore, aims to examine if the lending patterns of banks with respect to PSL to various states and regions in India are well-balanced and equitable. It is possible that some states and regions are commanding a relatively higher proportion of this credit while the others (maybe the needier and backward states) are left behind. The reasons for these lending patterns, especially in terms of the banks’ lending preferences and challenges, also need to be explored. A thorough analysis and understanding of these issues will help to formulate policy recommendations to make this program more effective to serve the national objectives and priorities of balanced and inclusive growth. Unlike normal commercial bank lending, directed lending is supposed to serve a social objective. It also involves a substantial proportion of the economy’s funds in most countries (40% of bank funds in India). Therefore, it is imperative that it contributes to this important national objective of reducing regional inequalities. It may be worth incorporating a few changes in DCP guidelines and taking a few other measures to ensure this. With these changes, the DCP can help contribute to achieve not just balanced sectoral growth as it does currently, but also to achieve balanced regional growth.
The rest of the paper is organized as follows. The next section is of “Literature Review”, which provides an assessment of some of the prior research studies related to this subject. This is followed by the section on “Data and Methodology”. This includes details on the data used for the study, primary and secondary, and tools of analysis. The section thereafter is of “Results and Discussion”, which explains the different findings from the study in terms of the PSL patterns across regions, states, special states, disparity in PSL and its change over time, relationship of PSL to state-specific characteristics, and PSL guideline suggestions. The final section of the present study is of “Concluding Comments”, which lists out the conclusions from the study, and policy recommendations emerging therefrom.
2. LITERATURE REVIEW
A number of studies have been conducted on the subject matter in the past. These relate to issues like regional disparities in the country, uneven flow of bank credit and directed lending (PSL) to various regions, the nexus between finance and economic growth of a region, challenges faced by banks in directed lending, policy suggestions, and so on.
2.1 Review of Prior Literature
The fact that regional disparity in economic performance across various states in India has increased in the post reform period since 1990s, has been found by many studies (Ahluwalia 2000; Jha 2000; Deaton and Dreze 2002; Singh et al. 2003; Ghosh and Chandrasekhar 2003; Sen and Himanshu 2004; NSS 70th Round 2013). As per the study by Suryanarayana, Agrawal, and Prabhu (2011), India lost 32% of its Human Development Index (HDI) value when inequality adjustments at the state level are made. Informal credit still remains a prominent source of finance in rural areas (Pradhan 2013).
PSL in India is a substantial part of bank credit in India, and also carries a social objective of balanced growth. The importance of banking development and capital in promoting economic development of different countries/ states has been established by various studies (King and Levine 1993; Jayaratne and Strahan 1996; Rajan and Zingales 1996; Christopoulos and Tsionas 2004). Further, the subject of how economic growth helps to reduce the regional disparities has also been explored by a few studies in the past (Dholakia 2003; Liang 2006). Specifically, some studies have also highlighted the role of PSL, as a special kind of bank credit, in reducing these regional disparities (Burgess, Pande, and Wong 2005; Pal and Ghosh 2007; S. Sharma 2008).
Despite the urgent need and importance to achieving balanced regional growth as a national objective, and the immense contribution of credit, especially PSL, to achieve this goal, there seem to be wide variations in flow of PSL to various states (Pai 1970; Angadi 1983; Shirota, Paulo, and Meyer 1990; Singh et al. 2003; Mohan 2006; World Bank Report 2006; Golait 2007; Resende 2008; Bhalla and Singh 2010; Önder and Özyıldırım 2010; Gandhimathi, Ambigadevi, and Shobana 2012).
A few prior studies have found that economic growth precedes banking development (Valverde and Fernández 2004; Zang and Kim 2007). Thus, it is possible that the states which have higher economic development receive higher per-capita PSL, thereby leaving behind the other backward states, which may need more attention. The economies of more economically advanced states are likely to have a higher per-capita income, service sector’s contribution to GDP, lower poverty levels and higher urban orientation (Kurian 2000; Rajan Committee Report 2013). Further, the states which have more banking development in terms of the presence of a stronger branch network and population coverage may also have higher per-capita PSL (Basu 1979; Angadi 1983; Ahmed 2010). It is also possible that PSL flow pattern to states follows the normal commercial credit flow pattern, even though its objective is vastly different and more social in nature (Basu 1979; Ahmed 2010). The economically advanced states generally have higher credit-deposit ratios (Pai 1970; Golait 2007) and may therefore have higher PSL as well. From the banks’ perspective, they may find it convenient and safer to lend to more credit worthy borrowers, who have lower risk of defaults and offer better collaterals (Banerjee, Cole, and Duflo 2003; Bhaumik and Piesse 2008). This may encourage them to lend higher amounts to states, which are more affluent and urban in nature, and are thus, expected to have a higher proportion of such credit worthy borrowers. The preference of banks in lending towards the more lucrative sectors of PSL, and urban areas, was also found by a few studies (Roy 2006; Rao, Das, and Singh 2006; Uppal 2009; Raman 2013; Kumar, Batra, and Deisting 2016).
The policy improvements in this regard can be better understood within the finance-growth nexus theories, which have been explored by various studies in the past. Some studies (King and Levine 1993; Jayaratne and Strahan 1996; Rajan and Zingales 1996; Levine and Zervos 1998; Christopoulos and Tsionas 2004) follow the Schumpeter line of thought that banking development helps promote economic growth and is thus, a critical determinant of economic growth. In contrast to this, few studies follow the Robinson view that, “where enterprise leads, finance follows”. This supports the theory that banking and financial development follow economic growth (Valverde and Fernández 2004; Zang and Kim 2007). In view of the above debate, Shan, Morris, and Sun (2001) rightly term it as “an egg and chicken problem”. The paper by Levine (1997) presents views on both sides of finance-growth relationship. Chakraborty (2008) found that up to 1996, financial development had caused economic growth in India. However, post this, the study finds that overall, it is the economic growth which has caused financial development in India. The study by Sehgal, Ahmad, and Deisting (2013) also found a bilateral causality between banking development and economic growth.
The above discussion highlights the role of the government, especially of state governments, in attracting bank credit by creating an economic environment which is conducive to investments. This will enable the provision of financially viable projects where the banks are able to give loans. Some studies, therefore, advocate the concept of fiscal federalism in this regard. Ahluwalia (2000) in his study opines that the states like Gujarat and Maharashtra in India have consistently performed well, not because the policies and benefits of liberalization were limited to them, but because they made good use of them by providing a conducive environment for investments and growth. Thus, balanced regional development can be achieved by emulating examples of high-growth states and helping them reach their potential. In addition, the Central government also needs to assist the efforts of these poorer states. The study advocates need-cum-performance based system of financial assistance from Centre to states. This system has also been recently recommended by Rajan Committee Rajan Committee Report (2013) which has proposed a revised methodology to construct the underdevelopment index for states in India. The study by Pal and Ghosh (2007) also suggests that fiscal federalism is especially relevant for large countries like India.
This is further supported by the study by Kurian (2000), which found that differences between forward and backward states are prominent. Even though the backward states need more investment in social and infrastructure sectors to be able to grow fast, investments are attracted to states with better administration, governance (less corruption, less inefficiency) and infrastructure facilities. Backward states do not have these and are thus caught in a vicious circle. Policy intervention is therefore required to reduce these interstate disparities, without which they will be aggravated. Since in post reforms period, role of central government in supporting states has been coming down, the onus is more on states to be able to create an environment to attract more investments. The World Bank Report (2006) also stresses on the fact (with case studies of Rajasthan and Bihar) that backward states need to make more efforts to exploit the growth opportunities available to them.
Further, even though banks can contribute significantly to ensure a balanced flow of directed lending to states where it may be required more, they face many implementation challenges in such lending. The most important factor for them is credit worthiness of borrowers, including lower risk of Non-Performing Assets (NPAs), sufficient collaterals, etc. (Banerjee, Cole, and Duflo 2003; Featherstone et al. 2007; Bhaumik and Piesse 2008). In addition, political interventions in the lending process, especially in agriculture, damage the repayment discipline of borrowers leading to reluctance of banks to lend to these sectors and regions, as was found by the studies of Guha (2009), Subramaniam and Subramaniam (2009) and Cole (2009). Finally, lower incentives to bank officers to lend to riskier areas like PSL may also be a deterrent to such lending, as was found by a few studies like of Banerjee, Cole, and Duflo (2003) and Banerjee and Duflo (2014). They found that the penalties for bad lending to loan officers are more than rewards for increased lending, leading to fear of prosecution, and thus inertia in lending. Therefore, banks may have a preference to lend to less risky and more profitable areas in PSL and may also be inclined to lend more to urban areas (Roy 2006; Rao, Das, and Singh 2006; Uppal 2009; Raman 2013; Kumar, Batra, and Deisting 2016).
In view of the above, it is important to understand the geographical distribution of directed lending, its determinants, challenges faced by banks, policies and structures, which will make it easier for them to lend to states and regions, which require special thrust for economic development. This will help to ensure an effective contribution of the DCP to balanced regional development.
2.2 Research gap
As seen above, a range of issues in such lending have been explored by academic research. However, this has been done in a specific context, either of highlighting regional disparity in lending, or of relationship of lending to a few state characteristics in isolation and not altogether as linked to each other. Furthermore, the time period covered is limited in most cases. Finally, only a few of them use in the same study, both secondary data analysis and primary survey to support each other. The present study, therefore, aims to fill these gaps through: a) integrating the related issues to understand the complete picture instead of taking them in isolation; b) taking a sufficiently long time period (from 1999 to 2013) for the study; c) using both secondary and primary tools of analysis. Secondary data analysis is supported with qualitative analysis from the primary survey to arrive at conclusions and recommendations for strengthening the PSL program.
2.3 Research Objective and Questions
The primary objective of this study is to examine the patterns of priority sector lending by banks across various regions and states in India, with a view to determining as to what extent the policy objective of balanced geographical growth, is being achieved through PSL, and to identifying state-specific characteristics, which may impact the distribution of PSL across states. The study thus, focusses on and seeks answers to a number of research questions, specifically the following: a) what are the patterns of PSL across regions and states in India?; b) have the PSL amounts concentrated in select geographical regions and states?; c) has the disparity in lending to various states significantly reduced over time?; d) are the states and regions as identified by the government as those needing special attention for economic development, receiving adequate credit through PSL?; e) what state-specific characteristics influence PSL patterns?; f) how can the PSL program be made more effective for lending by banks, in terms of the program’s contribution to balanced and equitable regional growth, thus ensuring inclusive growth?
As seen in the review of prior studies, in the earlier section and PSL regional patterns, it seems that the states which are economically more advanced and have better banking penetration, may be receiving higher PSL. More of such priority lending may be flowing to states with higher urban orientation and whose economies have higher service orientation as against an agricultural or industrial one. A summary of the variables emerging from and main findings of these studies which forms the basis for our hypothesis is presented in Table B of the Appendix.
Accordingly, the hypothesis for the present study is as follows:
H1.1: level of economic development of states has a significant impact on per-capita PSL of states.
H1.2: state urban orientation has a significant impact on per-capita PSL of states.
H1.3: agrarian/industry orientation of state economy has a significant impact on per-capita PSL of states.
H1.4: low bank penetration has a significant impact on per-capita PSL of states.
Significance level of 5% was used for the test.
3. DATA AND METHODOLOGY
The study is based on an analysis of secondary data regarding PSL flows and various economic indicators of different regions and states of India. It is supplemented by an analysis of primary data collected through a survey of ninety seven lending officers of different banks in India.
3.1 Secondary Data
PSL data is collated for analysis at two levels, region-wise and state-wise. Total and sectoral lending has been taken across regions and states to understand the patterns and preferences in lending. Regional analysis has been done by classifying the states into six different regions, based on the RBI scheme of classification. Data for twenty eight states and seven Union Territories has been taken from 1999 to 2013. The pattern of PSL has been analyzed for three main sub sectors, namely, agriculture, SSI (small-scale scale industries) and other PSL. The other PSL category includes loans to education, housing, SC/ST category, retail trade, road and water, small business, professionals and self-employed, etc. For trend analysis, data relating to the period from 1999 to 2013 was used. For Principal Component Analysis (PCA) and panel regression analysis, data relating to the period from 2005 to 2013 was used.
For analyzing the distribution of PSL across regions and states, per-capita PSL has been computed in order to take care of differences in their population. Wherever appropriate, data relating to the amount of PSL and percentage share of PSL for various regions and states, has also been used.
The categories of special states which require specific attention for growth as per national priorities, include: a) states of the North- Eastern Region; b) BIMARU states; c) other specially identified states (special category states, SCSs) as per the National Development Council and Rajan Committee Report, 2013.
The states included in each of these three categories of states are presented in Table 1.
Sources of data: the secondary data has primarily been taken from various publications and data archives of the RBI. This includes tables as listed under the head, “Statistical Tables Relating to Banks in India”, for each year of the study period. In addition, published data from the website of the Ministry of statistics and program implementation, and of the planning commission, have also been used.
3.2 Secondary data analysis
Apart from trend analysis, averages, growth rates, etc., the study uses the following tools of analysis.
To test the inequality of PSL dispersion across states, measures used are as follows: a) Coefficient of Variation (CV); b) ratio of sum of PSL to top 3 (and 5) states to sum of bottom 3 (and 5) states; c) HHI on percentage share of each state to total PSL of the entire country; d) percentage divergence of average per-capita PSL of special states form the national average, to understand the extent of gap, and its growth rate over the years; e) analysis based on Pareto analysis (80:20 rule).
Panel regression analysis with Principal Component Analysis (PCA) has been used to examine the role of state characteristics in distribution of per-capita PSL.
Based on the review of literature and government policy documents (summary presented in Appendix B), eight variables representing a state’s economic development and its level of banking development, were identified, and collated in a panel format (2005-2013). Since each of these variables is expressed in a different unit, they were scaled by taking deviations from their respective means, and then dividing this difference by their respective standard deviations, in order to ensure consistency. Principal Component Analysis (PCA), on a-priori basis, was used to reduce the number of variables to a few components, so that meaningful inferences on state characteristics can be drawn from them. These are as follows:
-
Level of Economic Development of state, comprising of the following two variables:
a. Per-Capita Income of the state {Per-Capita Net State Domestic Product at Constant (2004-05) Prices} as a measure of its level of economic development;
b. Percentage of people below the poverty line in the state, as a measure of its level of economic development in terms of its disparity and poverty levels;
-
State urban orientation represented by the variable, Percentage of Urban Population in the state;
-
Agrarian/ Industry orientation of state economy, comprising of the following three variables:
a. Percentage of Agriculture sector contribution to Gross State Domestic Product (GSDP), as an indication of agricultural orientation of state economy;
b. Percentage of Industry sector contribution to GSDP, as an indication of industrial orientation of state economy;
c. Percentage of Services’ sector contribution to GSDP, as an indication of services’ orientation of state economy;
-
Level of Bank Penetration in state, comprising of the following two variables:
a. Bank C/D (Credit to Deposit) Ratio in the state, as a measure of banks’ lending inclination to a state, and thus its level of bank penetration;
b. Population covered per Bank Office, as a measure of bank coverage and availability of bank services in a state, and therefore, its level of bank penetration.
A regression analysis was then carried out on these components. The problem of multicollinearity is expected to have been corrected in regression, since panel data has been used, and the VIF values for these components are within the acceptable tolerance limits (Gujarati 2003). The regression analysis was carried out separately with fixed effects and random effects. Based on Hausman test results, random effects were found to be better suited for the data taken. The presence of heteroskedacity in data was confirmed by Breusch and Pagan Lagrangian multiplier test for random effects. In order to correct this problem, cross-sectional time-series FGLS regression was run. The final results were obtained thereafter and analysed.
3.3 Primary Survey
A primary survey of lending officers of different banks was conducted to supplement the empirical results from secondary data analysis. This was done through a structured questionnaire which had detailed questions relating to lending preferences of banks in PSL, prime reasons for the same, and policy suggestions offered by them. The questions were a mix of ranking, rating and semantic scale based, depending upon their respective research objectives. Literature review and government policy documents were the primary basis for various factors and options listed under each of the survey questions. Further, adequate provision was made for open-ended questions to capture issues, which may have been missed out otherwise. These qualitative comments in open-ended questions, along with those emerging from personal interviews of some of the respondents, were separately analyzed. Their main themes were created and then related to the questionnaire findings.
The response to the questionnaire was received from ninety-seven lending officers of various banks. The respondent profile belonged mostly to the senior management of different banks. A validity test was conducted by expert opinion. Reliability test was done by Cronbach Alpha test, with results as: a) for Likert scale questions: α = 0.910, n= 109; b) for ranking questions: α = 0.746, n= 31. The main tools of analysis used for the primary survey were mean ranks/ scores, percentages, etc.
4. EMPIRICAL ANALYSIS
At the outset, the priority sector lending patterns of banks to various regions and states were analysed.
4.1 Directed Lending Patterns across Regions in India
Table 2 presents data relating to the distribution of PSL flows across different regions over the study period.
As it can be seen from Table 2, the highest percentage share of PSL of the country is of the Southern region (32.48%). The lowest share is of North-Eastern (NE) region (0.98%), followed by Eastern and then Central region. Per-capita PSL is also lowest for these same three regions. It is highest for the Western region (Rs.10, 424.8), followed by the Southern region. Similar patterns were noticed by earlier studies of Mohan (2006) and Gandhimathi, Ambigadevi, and Shobana (2012).
An analysis of sectoral distribution within each region exhibits an interesting pattern. Southern region ranks the highest in all the sectors in PSL both in terms of percentage PSL share of the country, as well as Per-Capita lending, with the exception that the SSI percentage share in this region was second highest. NE region, which had the lowest percentage share in each sector and its per-capita PSL, was also the lowest in each of the sectors namely, agriculture, SSI and weaker sections. Thus, the Southern region seems to be doing very well in terms of PSL. It may be worth studying the model of lending in this region, as to how and why the banks are able to lend in a better manner in this region, so that the lessons from here can be emulated by other regions as well. It is possible that banks’ culture, discipline and commitment to social cause may be higher here on account of their management orientation or other such factors. The idea that model of better performing states must be emulated by other states, was also proposed by a few prior studies (Ahluwalia 2000).
In order to examine the disparity in distribution of per-capita PSL within each region, Coefficient of Variation (CV) was computed for each region. As it may be observed from Table 2, the Northern region had the highest degree of disparity in per-capita PSL. The CV for per-capita PSL was also found to be comparatively higher in the case of Eastern and Western regions. This would imply that there are a few states in a region, which get a lower per-capita PSL than the regional average. Further, such a disparity has been growing over the years for most regions, and therefore, the need for state-wise analysis could easily be explained.
4.2 Directed Lending Patterns across States in India
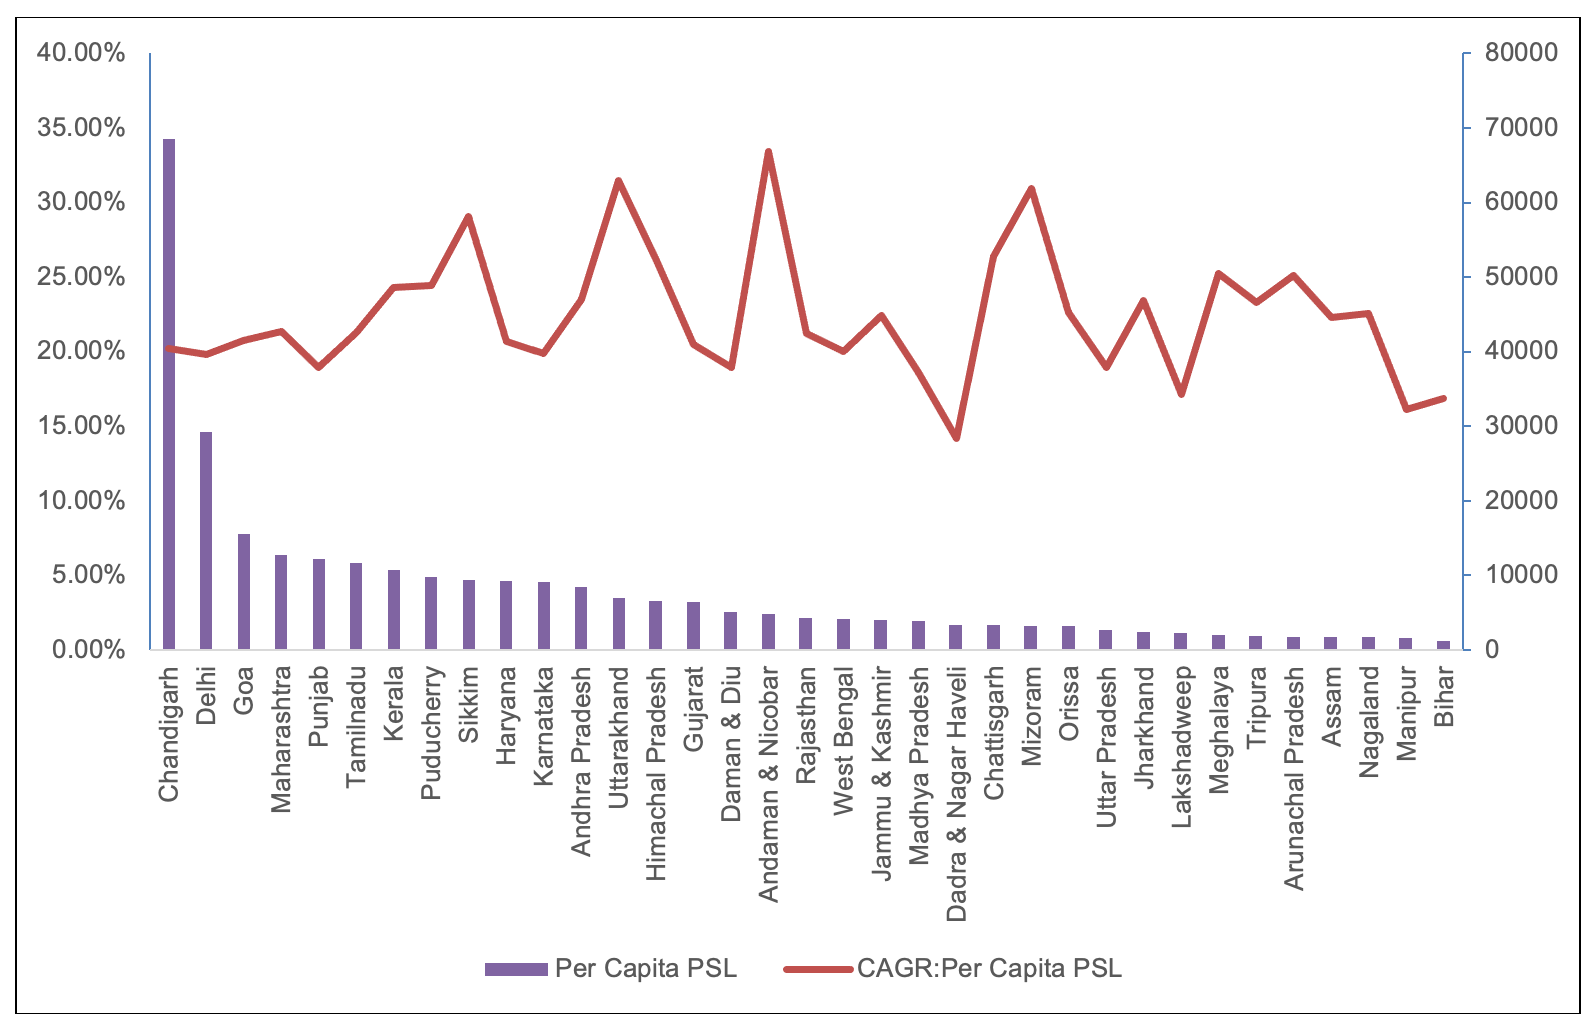
A state-wise analysis of PSL, per-capita and its growth rate was carried out. As can be observed from Figure 1, the three topmost ranking states in average per-capita PSL are Chandigarh, Delhi and Goa, which are also more economically developed. Most of the North Eastern region states, BIMARU states, and special category states, rank low here.
Taking the PSL sectoral per-capita lending situation, it can be seen that Chandigarh tops the list in all the sectors. The other states which figure in the top ten lists in most sectors, are the more economically developed states of Delhi, Maharashtra, Goa, Tamil Nadu, Punjab and Haryana. The states in the bottom ten list in all the sectors are mostly from north-eastern region and the BIMARU states. The only silver line is the higher rate of growth in per-capita PSL in some of the smaller states of the NE region like Mizoram, Sikkim, Meghalaya and Arunachal Pradesh. This phenomenon is however, not present in case of BIMARU states, which continue to have lower per-capita PSL, as well as a lower growth rate in per-capita PSL.
4.3 Disparity across States in Directed Lending
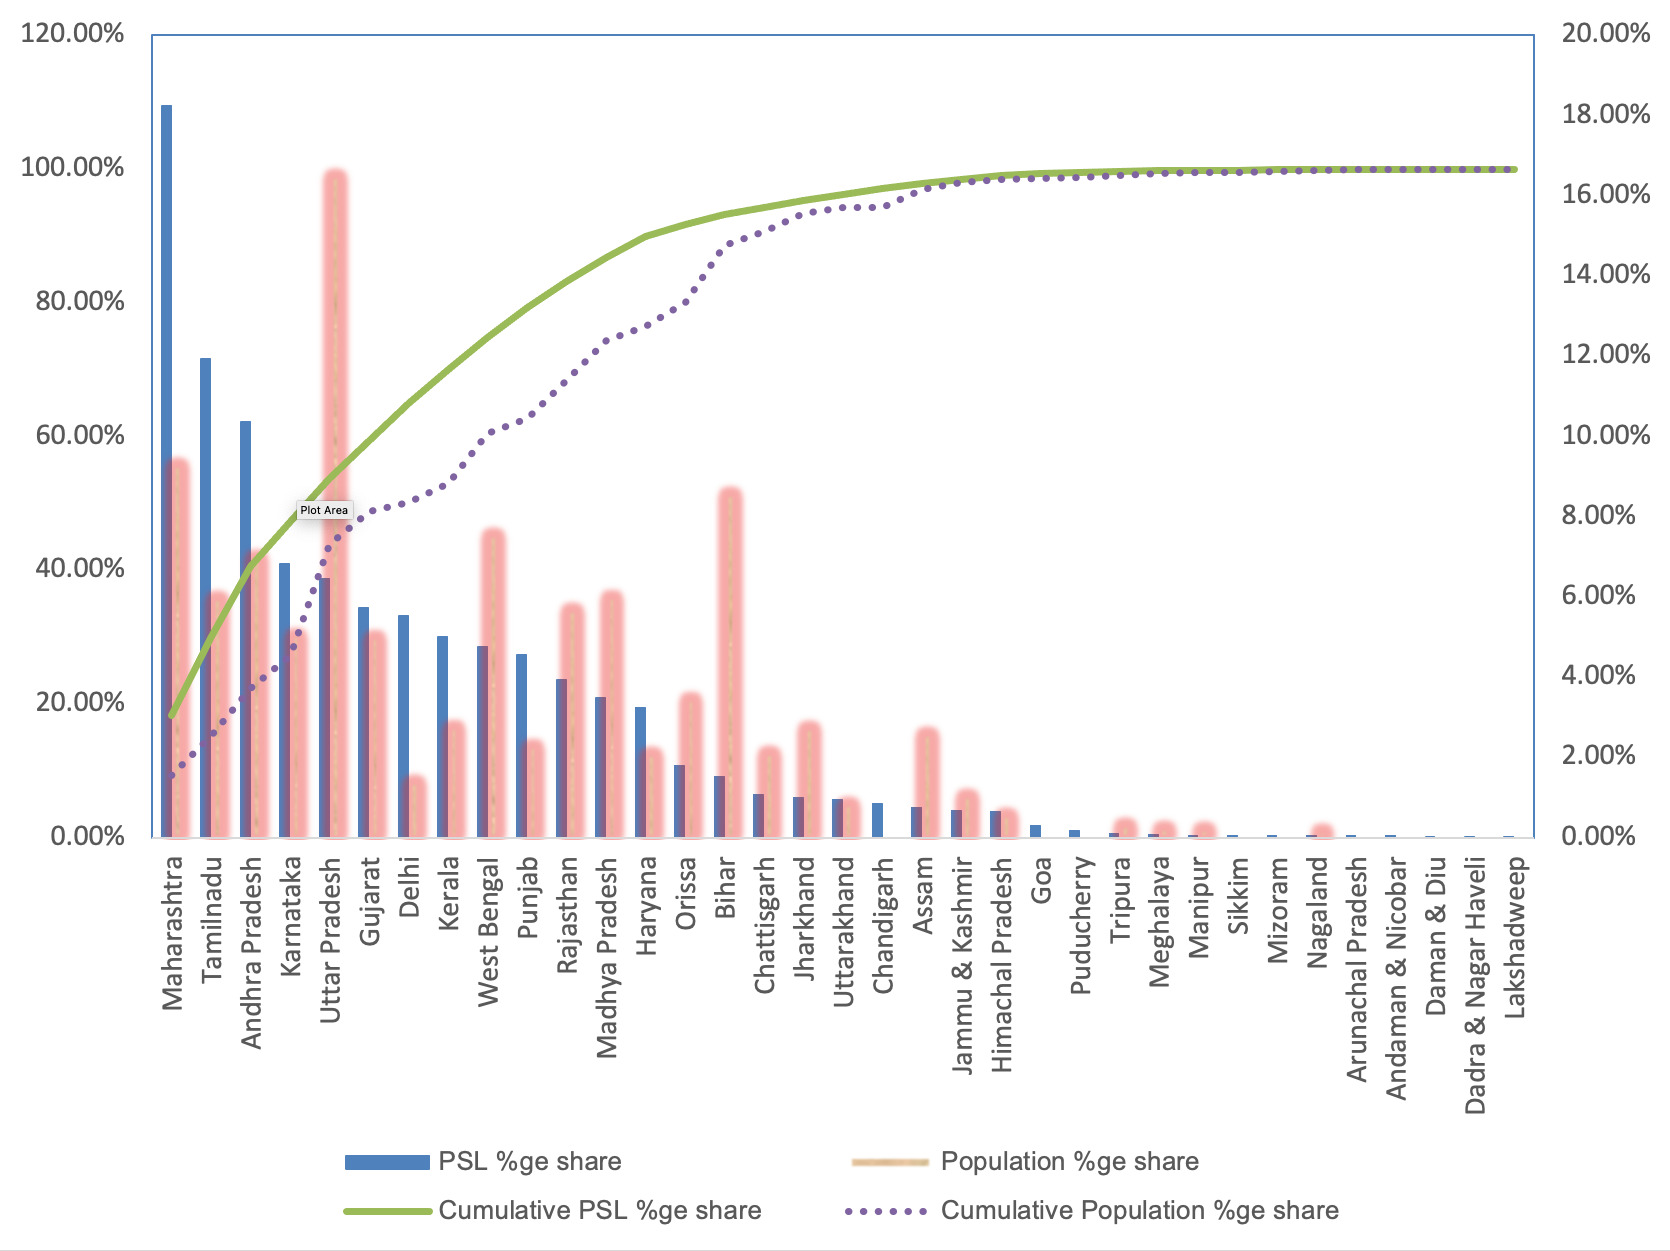
In order to get an overall view of the disparity in PSL flows across different states, a Pareto analysis was carried out for all the states, comparing their pattern of PSL percentage share and of their population percentage share of the national total. This is presented in Figure 2.
As it can be seen from Figure 2, there is substantial discrepancy between individual state’s percentage share of PSL and their population percentage share, indicating imbalances in the distribution of PSL. Some of the economically advanced states like Maharashtra, Tamil Nadu, Andhra Pradesh, etc. have higher PSL share and lower population share. As against this, some other states (mostly the BIMARU states, and states of NE region) have a lower PSL share and higher population share of national total.
The line graph of cumulative PSL percentage share of states is higher than that of the cumulative population percentage share. This is indicative of the discrepancy that PSL percentage share of states is not in line with their population percentage share. Almost 80% of the total PSL flows to merely ten states, which account for about 62% of the population. This includes the state of Uttar Pradesh (part of BIMARU states), which has the highest share of population of the country (16.49%), and receives just 6.44% of the PSL. Further, nearly half of the total amount of PSL of these ten states, flows to the top three states, which have about 22% of the nation’s population, and receive over 40% of total PSL of the country. The remaining states, which have virtually 40% share of population, receive only about 20% of PSL share. Majority percentage of the states in terms of the number (nineteen states) are receiving less than 1% share each of total PSL of the country. While these states account for nearly 10% of the population, they receive only about 5% of the total PSL.
The extent of disparity across states is also evident from the measures of dispersion computed from PSL data for the study period, and is collated in Table 3.
As it can be seen from Table 3, the coefficient of variation (CV) for total PSL and all the sectors therein is mostly higher than one indicating considerable disparity. The CV for per-capita agriculture lending is, in fact, higher than 2, thereby showing a significant disparity in this sector. The ratio of sum of per-capita PSL for top 3 states to bottom 3 states is a substantial figure of 33.18 for the total PSL, 96.25 for agriculture sector, and 50.84 for SSI sector, indicating high level of disparity in per-capita PSL. These figures are also higher than the ratio for top 5 to bottom 5 states, in total as well as the sectoral PSL. This signifies that the level of concentration is higher in top three states as compared to five states. The HHI, even though less than 1000, is quite close to it, and is higher than 1000 for the SSI sector. This signifies moderate concentration of percentage share of PSL across states, as per this index. The disparity seems to be the highest in the agriculture sector where most of the measures of dispersion show high values.
The above analysis shows that the disparity across states in total and sectoral PSL is quite high. The inequalities in PSL have also been indicated in a few earlier studies of Angadi (1983), Mohan (2006), World Bank Report (2006), Golait (2007), Bhalla and Singh (2010) and Gandhimathi, Ambigadevi, and Shobana (2012). However, the methodology used for the purpose differed in these studies.

4.4 Change in disparity in Directed Lending across States over time
The next issue is whether the disparity in PSL flows across various states is showing a declining trend over the study period. The year wise trend in the measures of dispersion in total PSL over the study period, is depicted in Figure 3.
As it can be seen from Figure 3, the disparity in PSL does not show a declining trend over the years. It seems to have gone up in a few years in between and then started declining. There is no clear trend of decline over the study period.
If we take the sectoral trends in change in disparity over time, by analyzing the growth rate (CAGR) in measures of dispersion for various sectors (presented in Appendix C), it shows a mixed trend in change in disparity across these sectors of PSL. While the measures of dispersion for per-capita lending in most sectors, show a decline (negative CAGR), it seems to have gone up in terms of percentage share of states for many sectors.
Further, if we observe the hierarchy of states in each year over the study period, mostly the same states appear in the list of top three and bottom three for most of the years throughout the study period, considering both per-capita PSL as well as the percentage PSL share. Further, it is the economically advanced states which consistently appear in the list of uppermost three. These are the states of Delhi, Goa and Chandigarh for highest per-capita PSL and of Maharashtra, Tamil Nadu, and Andhra Pradesh for percentage PSL share. The states which frequently appear in the list of bottom three are the less developed states of Bihar and those belonging to NE region. Thus, there has been no significant change in the hierarchy list of the states in this regard over the study period.
The above analysis shows that there is no definite declining trend of disparity in PSL and its sectors, across various states over the study period. The composition of front runner states and laggards, has not changed over the years. The findings in this regard follow the trend of other income inequalities across states being persistent and in fact, having increased in the post reform period in India, as was found by a few prior studies like of Ahluwalia (2000), Jha (2000), Kurian (2000), Singh et al. (2003), Ghosh and Chandrasekhar (2003), Sen and Himanshu (2004) and World Bank Report (2006).
4.5 Directed Lending Patterns across Special States
The above analysis highlights the unbalanced distribution of PSL flows and also lower growth rates in case of many states with low per-capita PSL. Such an imbalance is contrary to the objectives and priorities of the economic policy which PSL program may aim to serve. The three categories of states, which rank high on national priority for development, are clearly low performers in terms of access to PSL. These include states in NE region, BIMARU states and special category states (SCSs). An analysis of PSL flows to these ‘special’ states which deserve particular attention of the policy makers, is presented in the following paragraphs.
The relative neglect in flow of per-capita PSL to NE states, BIMARU states and other Special Category States (SCSs) is evident from the data in Table 4. The divergence of PSL of these states is calculated by taking the percentage by which their per-capita PSL is less than the per-capita PSL average of all states in India. A negative divergence signifies that the per-capita PSL average of special states is lower than the national PSL average, and a positive divergence signifies the opposite. In other words, the percentage divergence has been calculated as given below:
Percentage Divergence= (Special states′ Per Capita PSL Average−National Per Capita PSL Average)∗100/National Per Capita PSL average(1)
It was observed that the percentage divergence was negative without exception for each category of special states throughout the period of study. This clearly indicates that the special states are lagging behind where access to PSL is concerned. Any future changes in the PSL policy program must focus on reducing this imbalance in distribution of PSL.
As it may be observed from Table 4, the percentage divergence for all the special states taken together is as high as -60.38%. The divergence of average per-capita PSL for states of the NE region was the highest (-65.18%), followed by that of BIMARU states (-62.51%) and then by the special category states (-51.50%). This disparity has slightly declined over the years (CAGR of -1.34%) for all special states combined. The decline has been highest for special category states (-2.86% p.a.), followed by the NE region states (-1.13% p.a.). However, in case of BIMARU states, there has been an increase in this divergence by 0.956% p.a. Thus, in this respect as well, BIMARU states continue to remain so. These findings are consistent with the findings of the study by V. Sharma (2015), which concluded that BIMARU states have not converged to the national average in terms of certain demographic parameters, which were used to classify them in this category, in the original work of Bose (1988). Therefore, even after three decades of development planning, they continue to remain backward as a whole, in this regard underlining the need for policy makers to ensure more effective implementation of plans, and better governance, in order to achieve the desired goals.
The disparity in per-capita PSL within states of each of these categories is not very high as shown by the coefficient of variation (0.74 for all special states). This indicates that they are all in a similar state of deprivation in this regard. It is relatively higher for NE states (CV of 0.897). Moreover, this disparity seems to be increasing over the years, as shown by a positive CAGR in all these categories. In fact, it is highest for special category states (6.56% p.a.). This indicates that some states may be advancing faster than the others in this regard and the growth process is not balanced across these states.
The PSL patterns in terms of sectoral distribution for each of the categories of these special states were also analyzed. The percentage divergences in PSL to agriculture, SSI and weaker sections were computed (presented in Appendix D). As in the case of total PSL, the divergence in sectoral per-capita PSL of these states from All India average, also seems to be quite high. The highest divergence is in agriculture sector (-64.98%), followed by SSI sector (-61.08%) and then the weaker sections (-33.40%). This is in spite of the fact that many of these states are agro-based economies. The NE states have the highest divergence in both the sectors of agriculture (-81.86%) and SSI, (-73%), followed by BIMARU states (divergence of -51.37% in agriculture and -70.13% in SSI). The disparity in sectoral per-capita PSL and its growth rates, across states within each of these categories, is not very high, as seen by their reasonable CV figures. This implies that the deprivation of PSL in these sectors is uniform across various states in this category, and therefore, every state in this category deserves greater attention in this regard.
Perhaps, a ray of hope emerges from the higher growth rate in per-capita PSL of all special states taken together (percentage divergence: 5.08%). However, this divergence for BIMARU states is below the All India average (-15.42%), which shows that their growth is lagging behind than that of the national average. Sectorally, the trend is mixed. In general, the divergence in growth rate of per-capita PSL of SSI sector is higher (12.77%) than of agriculture (3.95%). This reflects greater scope of developing the SSI sector in these states. The growth of per-capita PSL of weaker sections is, however, lagging behind that of national average (-12.27%).
The analysis presented above highlights the fact that there is considerable disparity in PSL by banks across different states. It, therefore, underlines the need for identifying the factors which may have a significant impact on these PSL flows. These factors can help in making necessary policy interventions to correct the imbalances in PSL flows to various states.
4.6 Regression Analysis
In order to understand the factors which influence the geographical distribution of PSL, a number of state-specific economic characteristics affecting PSL distribution were identified using a Principal Component Analysis (PCA) and panel regression. The analysis is also supplemented by the findings of a survey of perceptions of ninety seven lending officers of various banks.
As highlighted in Table 5, the eight variables taken originally were reduced to four components to represent state-specific characteristics, by combining those which depicted a particular aspect of the level of a state’s economic and banking development.
The following regression equation was then estimated to understand the relationship of these components with per-capita PSL of states, and to thus, identify its determinants:
Per-capita PSL=α+β1(ED)+β2(UO)+β3(AIO)+β4(LowBP)(2)
The regression analysis was initially carried out separately with fixed effects and random effects. The Hausman test results (Prob> chi2 = 0.2210) confirmed that random effects is better suited for the data taken. The Breusch and Pagan Lagrangian multiplier test for random effects was then conducted to check for the presence of heteroskedacity in data. This was confirmed by the test (Prob>chibar2 =0.0000). Therefore, in order to correct this problem, cross-sectional time-series FGLS regression was run and generalized least squares estimates were obtained.
The results of PCA and regression analysis are presented in Tables 5 and 6 respectively.
The regression analysis showed a significant relationship of per-capita PSL to all the four components, as highlighted in Table 6.
a. Level of Economic Development of State: this component comprises of two variables, Per-capita Income of the state (positive) and percentage of people below the poverty line (BPL) in the state (negative). It has a positive and significant (p=0.000) impact on per-capita PSL in the state (β1 = 0.1547). Thus, the states which are more economically advanced in terms of a higher per-capita income and lower percentage of people BPL receive higher per-capita PSL from banks. Banks may therefore have been inclined to give higher PSL to the more affluent states. This is in line with the findings of the studies based on the Robinson view, like of Valverde and Fernández (2004) and Zang and Kim (2007), which have found that economic development in a region attracts higher banking credit. The studies by Gandhimathi, Ambigadevi, and Shobana (2012) and Shirota, Paulo, and Meyer (1990) also support this finding.
b. State Urban Orientation: this factor is represented by the variable, percentage of urban population in the state. It has a positive, significant (p=0.000) and the highest impact on per-capita PSL of the state (β2 = 0.3125). Thus, states with a higher percentage of population residing in urban areas receive higher per-capita PSL. The urban focus in lending and shift in lending preferences of banks to more lucrative sectors in PSL has also been found by a few prior studies (Basu 1979; Roy 2006; Rao, Das, and Singh 2006; Uppal 2009; Raman 2013; Kumar, Batra, and Deisting 2016).
c. Agrarian/ industry oriented state economy: this component reflects the composition of state economy and comprises of the contribution of the sectors of agriculture (positive), industry (positive) and services (negative), to the state GDP. This component thus reflects the agrarian/ industrial orientation of the state economy. It has a negative and significant (p=0.038) impact on per-capita PSL of the state (β3 = -0.0638). Hence, states which are more agrarian or industrial in nature receive lower per-capita PSL. Banks may therefore be more inclined to lend more to states, which have a higher percentage of their GDP from the services’ sector. However, the PSL program is meant to channel bank funds, mainly to the agriculture and SSI sectors. The agriculture target in PSL is quite substantial (18%). Banks are not being able to achieve these targets and growth rate of PSL to SSI sector is negative during the years (Ranjan 2014; Kumar, Batra, and Deisting 2016). The finding of the present study may thus provide some explanation to this trend as well.
d. Low Bank Penetration in State: this component comprises of two variables, population covered per bank office (positive) and CD ratio of banks in the state (negative). The component has a negative and significant (p=0.000) impact on per-capita PSL of the state (β4 = -0.1017). Thus, higher the population covered per bank branch in the state (signifying low bank reach) and lower the CD ratio of banks in the state (lower lending inclination of banks to the state), lower is the per-capita PSL of the state. Hence, states which have a low bank penetration in terms of the number of branches or credit amount received have a low per-capita PSL. The fact that bank branch expansion is a critical factor impacting PSL has also been found by a few prior studies like of Basu (1979), Angadi (1983) and Ahmed (2010). Moreover, this follows the studies based on the Schumpeter line of thought that banking development leads to higher economic growth in a region through flow of more bank credit, better efficiency of its usage, reduced cost of credit (King and Levine 1993; Jayaratne and Strahan 1996; Rajan and Zingales 1996; Christopoulos and Tsionas 2004). Further, since CD ratio is a variable in this component related to PSL, it implies that banks are following the geographical pattern of general commercial lending, in PSL as well. This may be because it helps them to avoid taking risks of fresh assessment decisions in PSL.
The economically advanced states are known to have higher per-capita incomes, lower percentage of people below poverty line, higher urbanization rate (Kurian 2000; Rajan Committee Report 2013) and deeper bank penetration (Pai 1970; Golait 2007). States whose economies are more service oriented rather than industrial or agrarian are also likely to be more affluent. Therefore, in sum, the above findings indicate that states which are more economically advanced are receiving a higher per-capita PSL, as against the backward ones.
4.6.1 Reasons for Lending Preferences
A survey of ninety-seven lending officers regarding the lending preferences of banks for PSL was also carried out. The findings help in understanding why these state-specific characteristics have a significant impact on PSL flows. It also helps in understanding the major challenges in implementation of the PSL program. The lending preferences and challenges clearly indicate that the present policy framework is not adequately helping in achieving the objectives of PSL program.
The regression results were substantiated by the survey response to the question where respondents were asked to rate the importance of state-specific characteristics, which may attract higher level of lending by banks to these states. The factors of “Higher banking presence and reach in a state (higher number of branches and lower population covered per branch)” and of “Higher level of affluence and richness of state (higher state per-capita income)” ranked high on the number of 4 and 5 respectively. Further, a maximum number of respondents (14 out of 85 i.e. over 16%) strongly agreed to each of these two factors. The factor of “Agriculture-based economy (higher contribution of agriculture to state GDP)” was ranked quite low. Furthermore, in terms of the sectoral preference in lending, agriculture ranked low, as against the other more lucrative options like housing. The urban orientation factor was also substantiated by the findings of the survey wherein 55.7% of the respondents opine that banks prefer to lend to borrowers in urban areas rather than in rural areas. The main reasons given for this preference are, “Easy access due to stronger network of urban branches”, “Better trained staff in urban branches”, and “Better ability to monitor urban loan accounts”. The qualitative comments in the survey also highlight the need for suitable training of staff for PSL. Further, the fact that “Borrowers are located in urban areas, which are easier to reach and access” was cited by the respondents as a prominent reason for preferring some sub sectors in PSL, over the others.
The main challenges in lending to PSL, total as well as sectoral, were cited by the respondents as, “Higher risk of default (NPAs)”, and followed by “Lower value of collateral offered against the loan”. It is possible that the economically developed states may have more borrowers with better probability of timely loan servicing and collaterals. It is thus, expected that banks will be more comfortable to lend to these states. In agriculture, the biggest challenge was cited as, “Policy interventions by the government like a loan waiver, etc”. Further, lending to economically weaker states involves more risk for banks and may deter the employees to lend there. In the survey as well, the reason of, “Possibility of administrative action against advances managers in case of high defaults (NPAs) in PSL accounts” was cited as the topmost ranked factor which may adversely affect the motivation of advances managers to focus on PSL. These findings, therefore, also highlight the need for devising suitable Human Resource (HR) policies for PSL in banks to encourage the bank lending officers to advance more amounts to PSL.
The above lending preferences and challenges create hurdles in achieving the policy objectives of balanced regional growth, thereby influencing adversely the effectiveness of the PSL program. Ideally, PSL must flow more to backward areas or to those with higher base of agriculture, SSI, weaker sections, etc., and to rural areas, rather than to those with service oriented economies or to urban areas. Therefore, the economically lesser advanced states should be receiving greater PSL if the program has to contribute effectively to the national objective of balanced regional growth. The analysis presented above, offers evidence to just the opposite of what is desired. Policy interventions perhaps can address the issue and improve the effectiveness of the PSL program.
4.7 Policy Suggestions Emerging from Survey
The findings of the present study recommend that changes must be made in the current PSL guidelines to incorporate provisions, which encourage and monitor the state-wise lending by banks. This is in addition to the sector-wise lending, which is the existing focus of these guidelines. This will help to ensure that the program is aligned with the national objective of balanced regional development. In the survey of opinions of lending officers of various banks, nearly 90.6% of the respondents supported this idea. Further, during this survey, an attempt was also made to seek suggestions for possible changes in the PSL guidelines which could promote more balanced distribution of PSL across states. Table 7 presents the select descriptive data from the responses.
As it can be seen from Table 7, the suggestions emerging from the responses to the survey primarily relate to introduction of the concept of Adjusted PSL (APSL) in the policy guidelines. Such a concept is being discussed in some banking circles and is also a part of our qualitative comments in the survey. The objective is to provide an incentive to banks to give higher PSL to more difficult regions and states, by building it into the PSL target compliance system of banks. In addition, a couple of other suggestions have also emerged from the survey, including widening of the scope of PSL. Expansion of the list of eligible sectors to align them to peculiar economic, geographic, demographic or such other conditions of each state, may enable more PSL to flow to these states. The other suggestions in the survey relate to monitoring of per-capita PSL, instead of total PSL amount, for each state by banks in order to account for population differences across states, and to have a ceiling for per-capita PSL to high per-capita income ranking states.
Some respondents opined in their qualitative comments in the survey, that it is the State-Level Bankers Committee (SLBC) for each state, which determines the credit plan for a state, in consultation with the concerned state government. Within this, factors like credit absorption potential of the state, natures of activities to be financed depending on the availability of bankable schemes, etc. are reckoned. Thus, SLBC may be allowed to propose more sectors to be included under PSL for each state. Further, the PSL by banks mostly dovetails with annual allocation plans of states with state budgetary allocation (district wise). There is also a need to work on entire rural and value chain approach with credit being an enabling factor.
Thus, considering that both the aspects, sectoral and regional, of the national priority of balanced development are important, directed lending programs should be made to align to both of them. Since PSL calls for an investment of a substantial proportion of bank funds, and has a social objective to serve, it should be used in an optimal manner, and not for limited objectives. Sound design of the program in terms of the guidelines is as important as its effective implementation, as also providing a conducive environment for such a lending. A holistic approach is therefore required for efforts to be made for changes by all players (RBI, banks, state governments etc.), and in all respects (e.g., policy, guidelines, structure, culture, investment environment etc.), for a more productive outcome of the program. The commitment of the banks to the social cause underlying the PSL is quite evident. However, they seem to be facing a number of challenges in its implementation. Therefore, a push and pull strategy, may help to make it easier for them to lend effectively under the program. The push factor needs to come from the RBI, policy makers and banks, by making requisite changes for strengthening the program. This needs to be done through both, guideline changes and process improvements in banks to make their culture more conducive for directed lending. The pull factor needs to come from the state governments of backward states by setting up more branches, strengthening the existing bank branches, and by creating a more investment friendly environment. This will inspire more confidence of the lenders and investors, thereby attracting more of directed lending to them. An effective co-ordination is required amongst the various arms of government, policy makers, RBI, banks etc. to enable a productive design and implementation of the program.
5. CONCLUSIONS
The findings of the present study suggest that there is a considerable disparity in the distribution of per-capita PSL across various regions and states in India. The Southern region ranks high on different parameters of PSL, while the NE region ranks the lowest (both, total and sectoral). The analysis of various measures of dispersion and their change over time suggest that the disparity in geographical flows of PSL, besides being high, have not shown a declining pattern over the years during the study period. Economically advanced states like Chandigarh, Delhi and Goa, rank high in per-capita PSL, while those of NE region, BIMARU states and the special states identified in government plans for development, rank much lower, in most of the years in the study period. The average per-capita PSL of special states was found to be lower than the All India average, by 60.38%. Further, the disparity across states in these special category states is relatively low, implying that they are mostly in a similar state of deprivation. Some of the earlier studies have also found such geographic disparities in lending (Angadi 1983; Bose 1988; Mohan 2006; Golait 2007; Bhalla and Singh 2010; Gandhimathi, Ambigadevi, and Shobana 2012; V. Sharma 2015).
State-specific characteristics which were found to have a positive and significant impact on PSL flows included level of economic development of the state and its urban orientation, while those having a negative and significant impact included agrarian/industry oriented state economy, and low bank penetration in the state. This implies that banks are giving higher PSL to states with higher urban orientation, higher level of economic development, lower agrarian/ industry oriented economy and higher banking penetration. The results are also supported by the survey findings.
In sum, the above findings show that it is the economically developed states which are continuing to receive higher PSL, while the backward states are lagging behind in this respect. The states which are economically developed have higher per-capita income, lower percentage of population below poverty line, higher urban population, and higher contribution of the service sector (as against agriculture and industry) to its GDP (Kurian 2000; Rajan Committee Report 2013). Such states also have higher banking penetration in terms of higher CD ratios (Pai 1970; Golait 2007). In addition, many of the previous studies have found that banking development is important to boosting economic growth of a region (King and Levine 1993; Jayaratne and Strahan 1996; Rajan and Zingales 1996; Christopoulos and Tsionas 2004). Thus, banking development, and specifically PSL, could help to reduce regional inequalities (Dholakia 2003; Burgess, Pande, and Wong 2005; Liang 2006; Pal and Ghosh 2007; S. Sharma 2008). However, while the higher banking development of a state can help its economic development through higher directed lending, it seems that higher PSL is flowing to states, which are already economically advanced. Some of the earlier finance-growth nexus studies have also found a bi-directional relationship between banking and economic development (Levine 1997; Shan, Morris, and Sun 2001; Chakraborty 2008; Sehgal, Ahmad, and Deisting 2013).
Thus, as was found by some of the earlier studies, DCPs have the potential to make a positive impact on the economic development of various countries where they are implemented (Besley 1994; Eastwood and Kohli 1999; Burgess, Pande, and Wong 2005; Swamy 2011; Banerjee and Duflo 2014). However, the program needs to be flexible and continually reviewed to adapt to the changing requirements and priorities of an economy. It is therefore, important to evaluate and take appropriate measures to enhance the effectiveness of the program, particularly from the perspective of balanced regional development as a national priority.